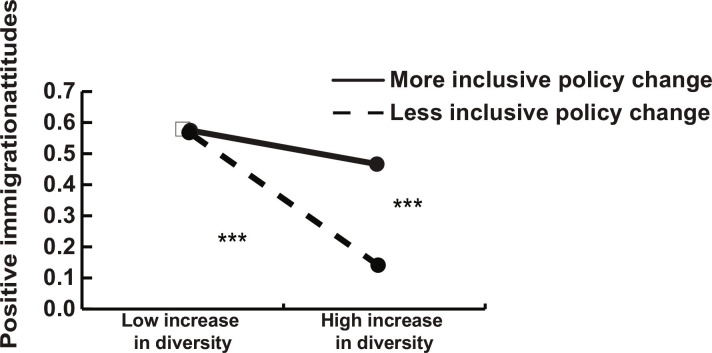
Fig. 5. Study 4.
Change in diversity (continuous variable) and change in policy (continuous variable) predicting positive immigration attitudes (low increase in diversity and less inclusive policy change defined as −1 SD from the mean, high increase in diversity, and more inclusive policy change defined as +1 SD from the mean).***P < 0.001 (two-tailed).

