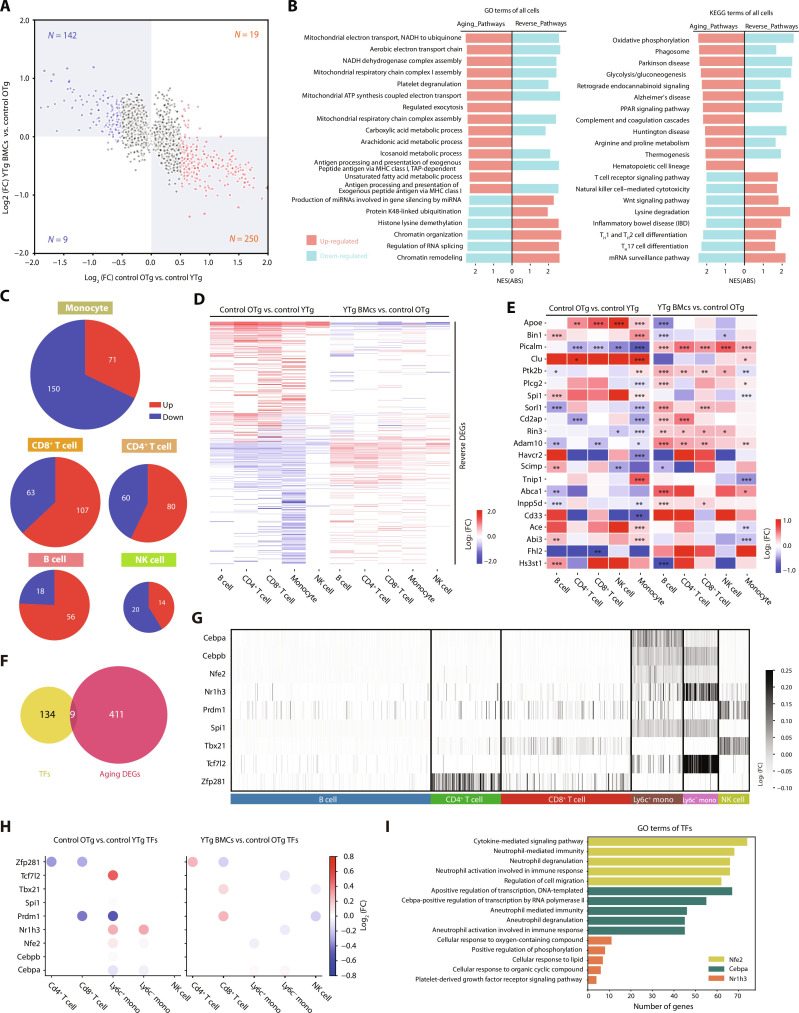
Fig. 2. Young BMT restored the expression of aging DEGs in multiple cell types of PBMCs.
(A) Scatter plot of the general aging differentially expressed genes (DEGs; cutoff by P < 0.05, log2FC > 0.5) in PBMCs. (B) The Gene Ontology (GO) and Kyoto Encyclopedia of Genes and Genomes (KEGG) terms enriched by the general aging and reverse DEGs. Red: up-regulated pathways; blue: down-regulated pathways. (C) Pie plots of the aging DEGs in monocytes, CD8+ T cells, CD4+ T cells, B cells, and NK cells. (D) Heatmap of the reversed DEGs in each cell type alongside the young BMT. The color key indicates the log2FC values. (E) The expression of differentially expressed AD risk genes in aging and BMT of B cells, CD4+ T cells, CD8+ T cells, NK cells, and monocytes. The color indicates the log2FC values. (F) Venn plot of the identified transcription factors (TFs) and aging DEGs in PBMCs. (G) Heatmap of the expression level of TFs in each cell type. The color key indicates the log2FC values. (H) Dot plots of the effects of aging and young BMT on TFs expression. The color key indicates the log2FC values. (I) Bar plots of the GO terms enriched by the target genes of Nfe2, Cepbp, and Nr1h3. The downstream genes of Nfe2, Cepbp, and Nr1h3 were obtained from the regulon analysis using SCENIC, and the genes identified through SCENIC analysis may not be DEGs. *P < 0.05; **P < 0.01; ***P < 0.001. The error bars are the SEMs. NES(ABS), absolute normalized enrichment score; FC, fold change.

