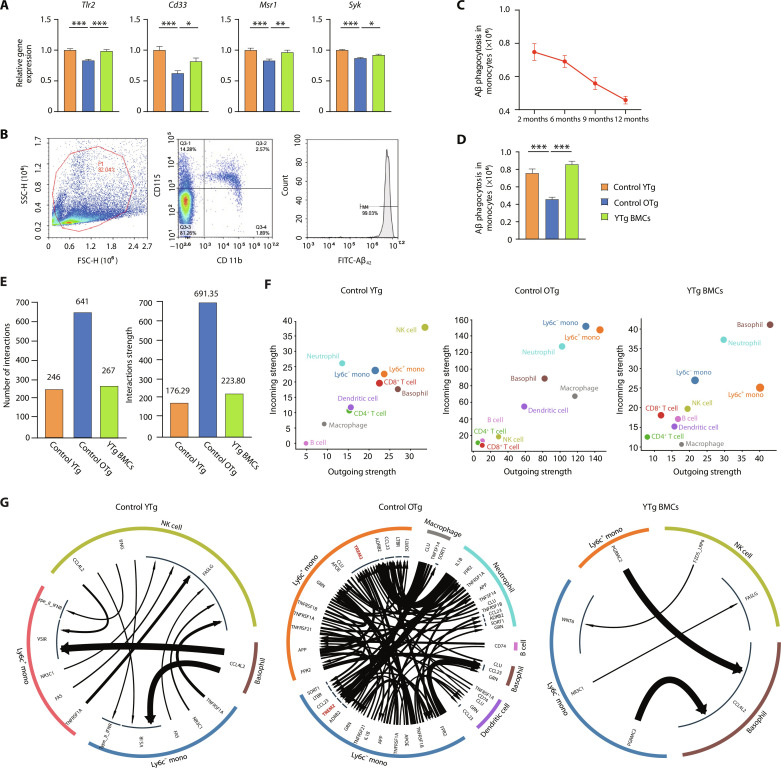
Fig. 3. Young BMT rescued the impaired Aβ phagocytosis capacity of blood monocytes.
(A) Levels of expression of the Aβ uptake-related receptors Tlr2, Cd33, Msr1, and Syk. One-way analysis of variance (ANOVA). (B) In vitro analysis of Aβ42 phagocytosis by monocytes with flow cytometry. (C and D) Quantification of the levels of monocyte Aβ42 uptake. One-way ANOVA. (E) Bar plots of the number and strength of cell interactions in control YTg, control OTg, and YTg BMC mice. (F) Scatter plots of cell interaction strength in control YTg, control OTg, and YTg BMC mice. (G) Cell-to-cell interaction network between monocytes and the rest of the cell types. *P < 0.05; **P < 0.01; ***P < 0.001. The error bars are the SEMs.

