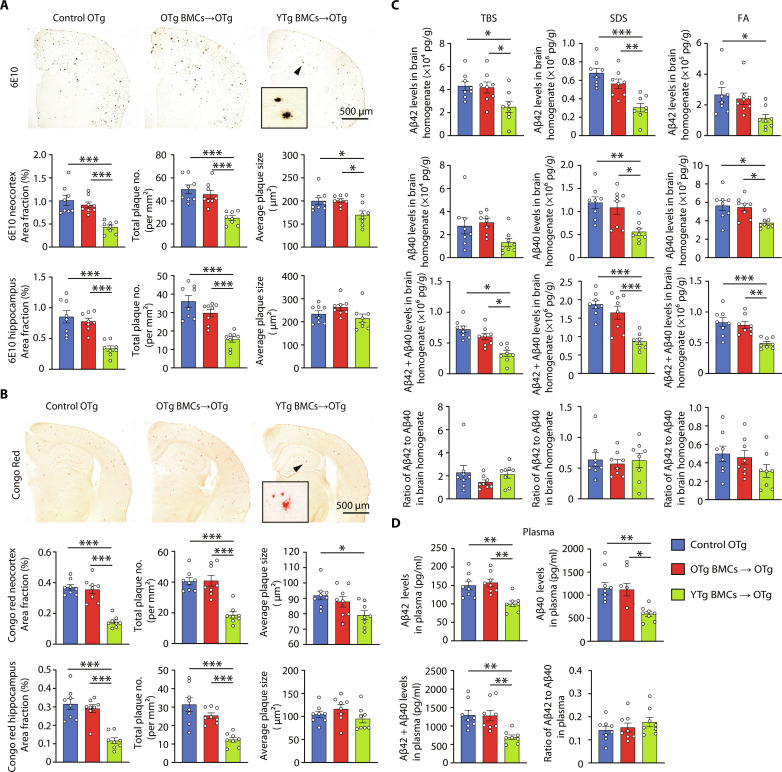
Fig. 4. Young BMT reduced Aβ levels in APP/PS1 mice.
(A and B) Immunostaining and quantification of Aβ plaques stained with 6E10 (total plaques) and Congo red (dense plaques) in the neocortices and hippocampus of APP/PS1 mice with or without BMT. One-way ANOVA. (C) Comparison of Aβ40 and Aβ42 levels, Aβ40/Aβ42 ratios in the tris-buffered saline (TBS; soluble extracellular Aβ), SDS (intracellular Aβ), and FA (dense plaques Aβ) fractions of brain homogenates among BMT and control mice. One-way ANOVA. (D) Comparison of Aβ40 and Aβ42 levels, Aβ40/Aβ42 ratio in plasma among BMT and control mice. One-way ANOVA. n = 8 per group. *P < 0.05; **P < 0.01; ***P < 0.001. The scale bar is 500 μm. The error bars are the SEMs. FA, formic acid.

