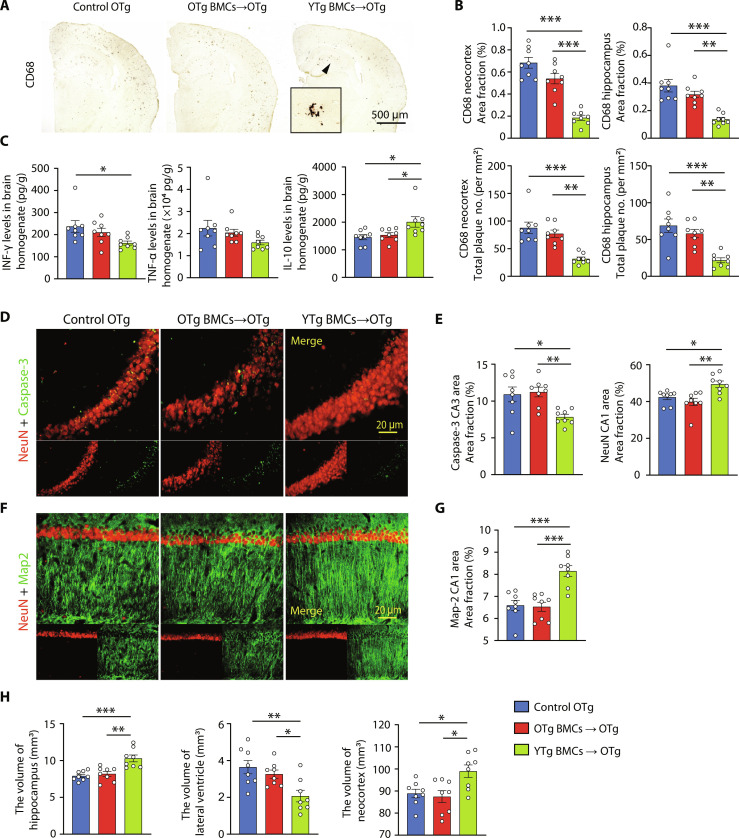
Fig. 5. Young BMT alleviated AD-related pathogenesis.
(A and B) Immunostaining and quantification of microglia stained with CD68 in the neocortex and hippocampus of APP/PS1 mice with or without BMT. One-way ANOVA. (C) Statistical analysis of the levels of inflammatory factors, including interferon-γ (IFN-γ), tumor necrosis factor–α (TNF-α), and interleukin-10 (IL-10), in brain homogenate. One-way ANOVA. (D to G) Representative images and quantification of neurons (NeuN, red) and dendrites (MAP2, green) in the hippocampal CA1 region and neural apoptosis (caspase-3, green) in the hippocampal CA3 region. One-way ANOVA. (H) Volumes of the hippocampus, lateral ventricle, and neocortex. One-way ANOVA. n = 8 per group; *P < 0.05; **P < 0.01; ***P < 0.001. The scale bar in (A) is 500 μm, and the scale bars in (D) and (F) are 20 μm. The error bars are the SEMs.

