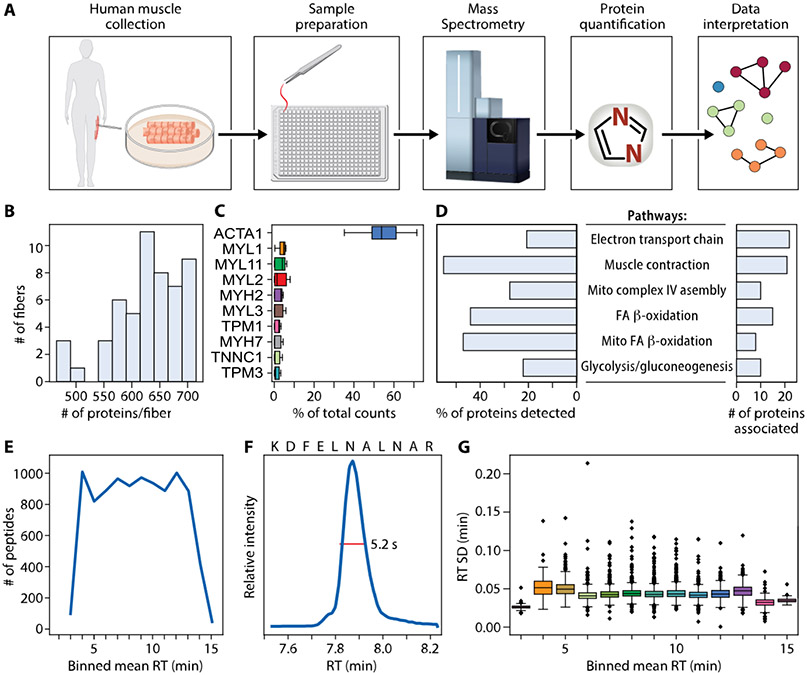
Figure 1.
Data and workflow overview. (A) Muscle biopsies were collected from two healthy female donors. Fibers were processed using one pot in-solution digestion in a 384-well plate, and data were acquired by DIA-PASEF on a Bruker timsTOF SCP. Proteins were quantified using library-free search with DIA-NN against the whole human proteome. Clustering allowed for visualization of similarly grouped fibers. Top ranked proteins distinguishing clusters were then used to understand biological pathways. (B) Number of proteins quantified per fiber. (C) Ten proteins with highest percent of total counts in each fiber. (D) WikiPathways term enrichment analysis summary of all 744 proteins identified in any fiber. (E) Number of peptides quantified per minute across binned mean retention times (RT). (F) Extracted ion chromatogram showing a typical full width at half-maximum (fwhm) of 5.2 s for example peptide KDFELNALNAR. (G) RT standard deviation in minutes across binned mean RTs.

