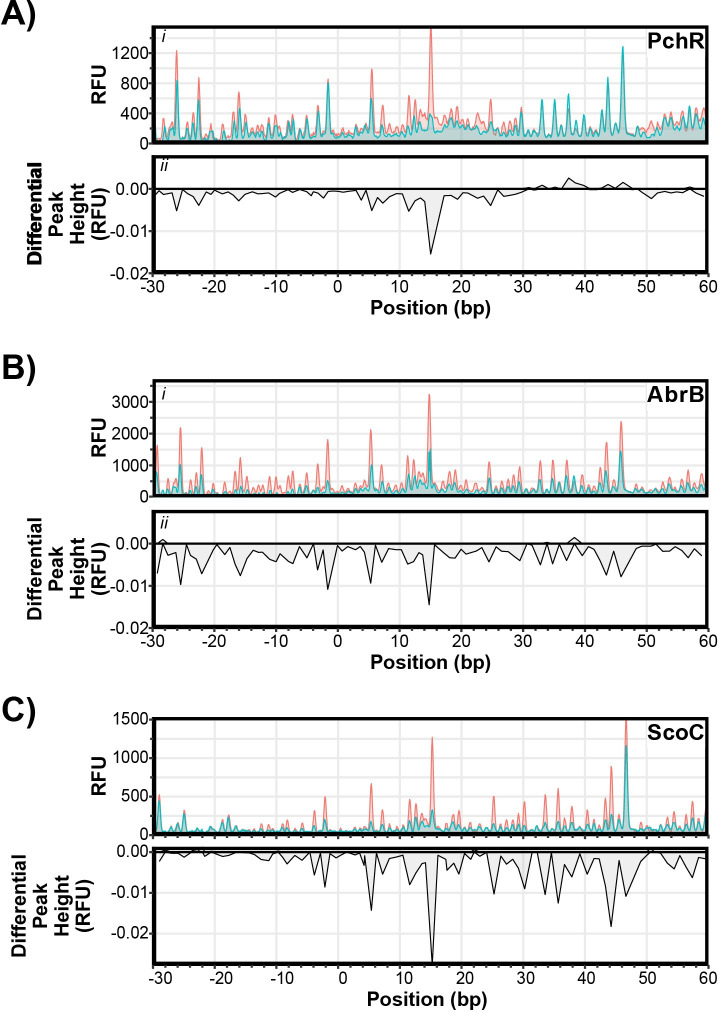
Fig 5. DNase I Protection Varies Among ScoC, PchR, and AbrB.
Electropherograms of fluorescent DNase I footprinting analysis of PchR (A, 250 nM), AbrB (B, 500 nM), and ScoC (C, 1000 nM) with fluorescently labeled yvmC promoter as a function of estimated nucleotide position. Fluorescence intensity (RFU, panel i) of reactions incubated with (blue) and without protein (red). Differential peak height (panel ii) between reactions with protein and without protein. Differential peak heights less than zero indicate protection while differential peak heights greater than zero indicate hypersensitivity.

