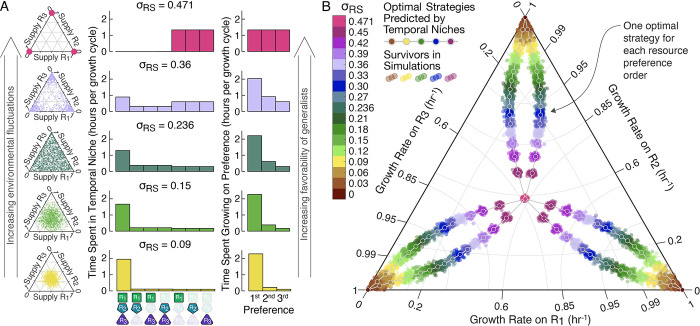
Fig 5. Temporal niches explain the composition of highly diverse communities in fluctuating environments.
(A) We extended the resource supply sampling distributions to now have a maximum value σRS = 0.471, corresponding to a single randomly supplied resource on each growth cycle. Resource supply distributions are shown in the left column on the same simplex diagrams as in Fig 4B. We then simulated the 100 random communities of 5000 species from Fig 4 at 8 additional magnitudes for 17 total fluctuation magnitudes from σRS = 0 to σRS = 0.471. To develop a prediction of optimal strategies, we began by looking at the time spent in each temporal niche (middle column) and the time species spent growing on each of their resource preferences (right column). As the environmental fluctuation magnitude increased so did the time species spent growing on their second and third preferences, which would favor resource generalists. (B) Because species had been sampled with a metabolic constraint on their growth rates (), we could predict the optimal strategies (Section B in S1 Text). We compared these optimal strategies against the survivors in simulations using a simplex plot which is nonlinear in gμi but in which complete specialization on a single resource still maps to the corners and equal investment in all resources still maps to the center (Methods, Section A in S1 Text). At all fluctuation magnitudes, survivor growth rates are tightly clustered around the predicted optimal strategies.

