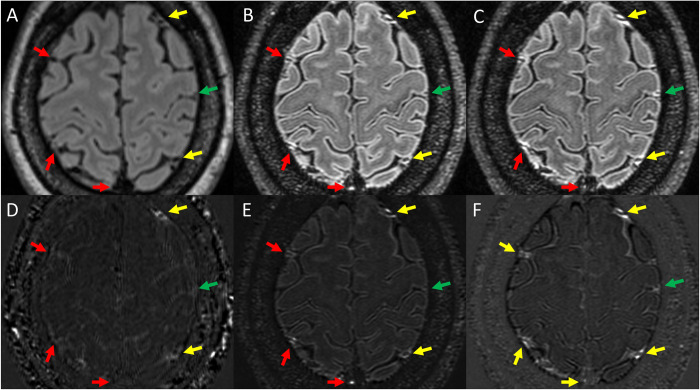
Fig 3. Examples of PDE as visualized on various Gd+ imaging protocols.
Shown is Gd+ Delayed 3T FLAIR (A), Gd+ Early 7T FLAIR (B), and Gd+ Delayed 7T FLAIR (C). Also shown are subtraction maps created by subtraction of A from pre-Gd 3T FLAIR (D) and B and C subtracted from pre-Gd 7T FLAIR (E and F, respectively). Yellow arrows indicate foci of PDE seen on all 3 protocols. Red arrows indicate regions where PDE was seen on both 7T protocols but could not be seen on Gd+ Delayed 3T FLAIR. The green arrow indicates a region where PDE was seen on Gd+ Delayed 7T FLAIR, but could not be seen on Gd+ FLAIR or Gd+ Early 7T FLAIR.

