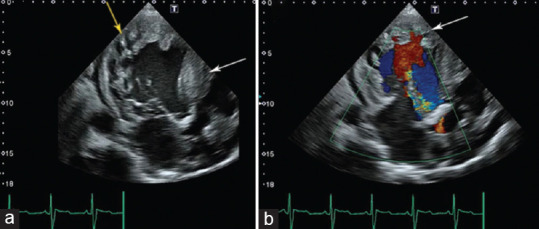
Figure 2.

(a) Transesophageal echocardiography demonstrating the noncompacted myocardium (yellow arrow) and asymmetrical septal hypertrophy (white arrow), (b) Color Doppler echocardiography demonstrating color Doppler blood flow into the intertrabecular recesses (arrow) [Video 2]
