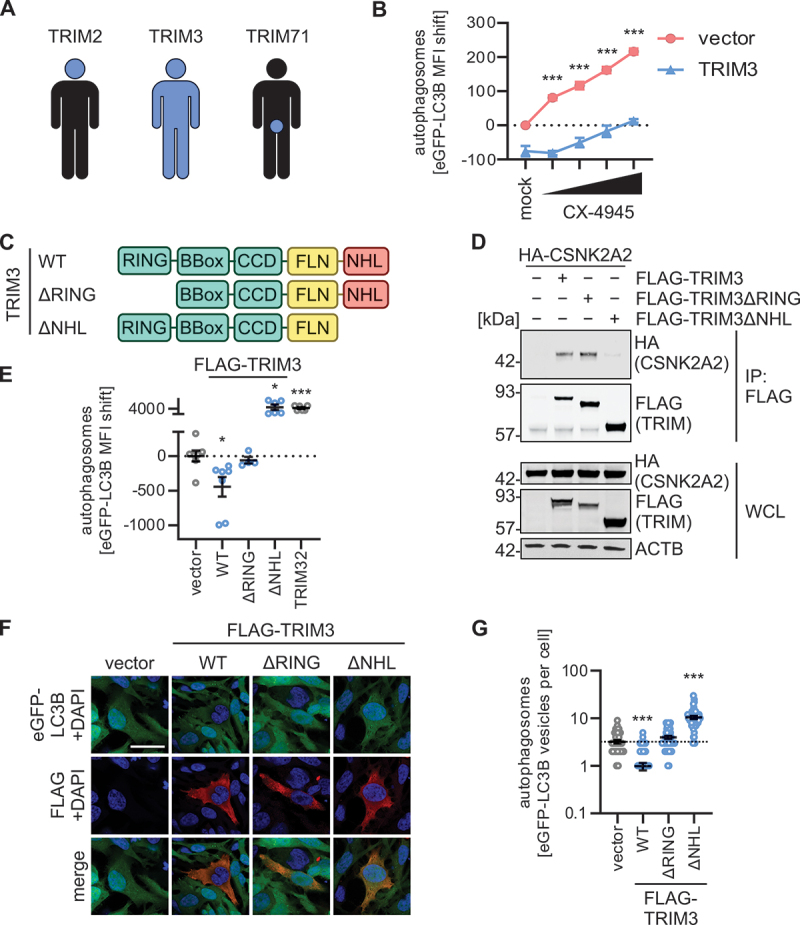
Figure 5.

TRIM3 mediated autophagy modulation is dependent on its NHL domain. (A) Schematic depiction of the expression patterns of TRIM2, TRIM3 and TRIM71 across the human body. See Figure S5A. (B) Quantification of autophagosome levels (eGFP-LC3B MFI) in HEK293T GL cells transiently expressing TRIM3 or a vector control. 48 h post transfection, cells were treated with increasing concentration of CX-4945 (4 h) and autophagosome levels (eGFP-LC3B MFI) were quantified using flow cytometry. Treatment with bafilomycin A1 (BafA1, 250 nM) was used as a positive control. Lines represent mean ± SEM, n = 3. (C) Schematic depiction of the domain organization of TRIM3 and the ΔRING and ΔNHL truncation mutants. (D) Anti-FLAG immunoprecipitation (IP) in whole cell lysates of HEK293T cells transiently expressing HA-tagged CSNK2A2 and indicated FLAG-tagged TRIM3 constructs. 48 h post transfection whole cell lysates (WCLs) and precipitates were analyzed by immunoblotting. Blots were stained with anti-HA, anti-FLAG and anti-ACTB. (E) Quantification of autophagosome levels (eGFP-LC3B MFI, 48 h post transfection) in HEK293T GL cells transiently expressing indicated TRIM3 truncation mutants. Lines represent mean ± SEM, n = 3. (F) Representative confocal laser scanning fluorescence microscopy images of HeLa GL cells transiently expressing indicated FLAG-tagged TRIM3 constructs (48 h post transfection). TRIMs (FLAG, red), eGFP-LC3B (green), nuclei (DAPI, blue). Scale bar: 10 µm. (G) Quantification of the eGFP-puncta area per cell in the images from (F). Lines represent mean ± SEM, n = 42–57 (individual cells). Student’s t-test with Welch correction. *, p < 0.05; ***, p < 0.001.
