Figure 3.

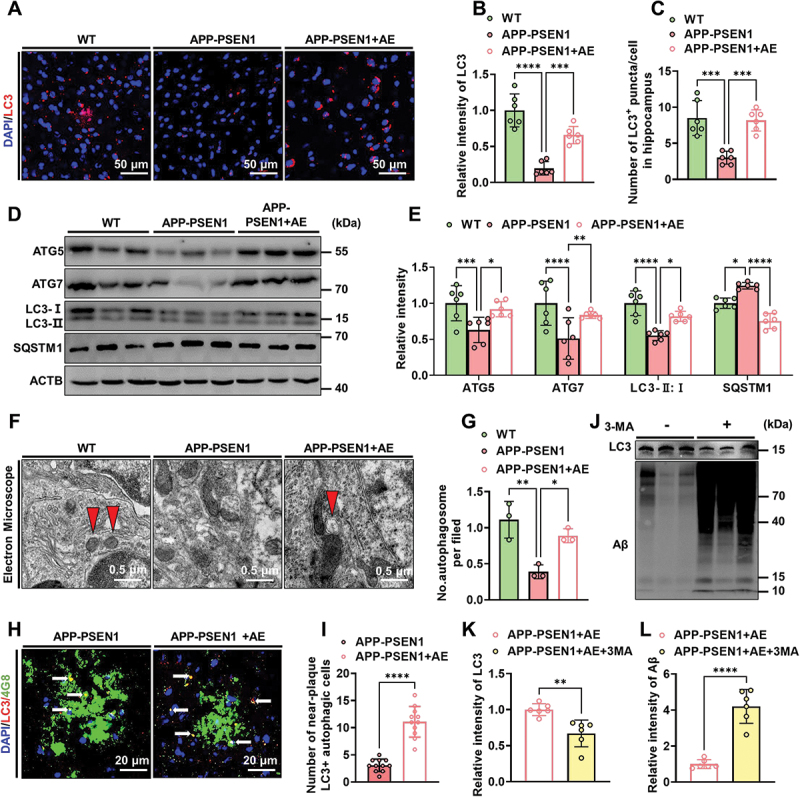
AE enhances autophagy levels in APP-PSEN1 mice. (A) Representative images of the intensity of LC3 in the hippocampus of the mice. (B and C) quantification of LC3 fluorescence intensity and average number of LC3+ puncta per cell in the brain. (D and E) the levels of ATG5, ATG7, LC3-II:I and SQSTM1 in the hippocampus were detected using western blotting and quantitatively analyzed. (F) electron microscopy analysis of autophagosomes. Arrows indicate the autophagosomes (scale bar: 0.5 μm). (G) quantification of autophagosomes. (H) Representative confocal images of LC3 and 4G8 immunofluorescence colabeling. (I) quantification of the number of LC3-positive cells near Aβ plaques. (J-L) Representative images and quantification of the intensity of LC3 and Aβ in the hippocampus of AE mice after 3-MA treatment. n = 6 mice per group. *P < 0.05; **P < 0.01; ***P < 0.001; ****P < 0.0001. The data are presented as the means ± SEMs. One-way ANOVA followed by Bonferroni’s post hoc test was used to analyze the data in (B and C). Two-way ANOVA followed by Bonferroni’s post hoc test was used to analyze the data in (E, G). Student’s t tests were used to analyze the data in (I-L).
