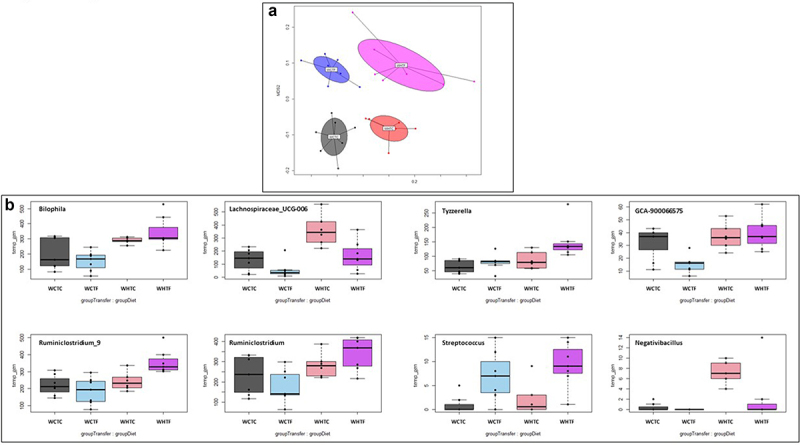
Figure 8.

Impact of HFD on microbiota analysis in WT mice transplanted with WT or fat-1 microbiome.
WT mice were transplanted with the microbiome of WT or fat-1 mice and fed CTL or HF diet for 12 weeks. a: The NMDS representation of the microbiota of mice transferred with control donor or fat-1 donors allows discrimination of the four groups at week 12 based on the Bray-Curtis distance. The same color code as Figure 5 was used. The Stress in the NMDS representation was 16.9%. b: Major bacterial genera encountered in WT mice transplanted with the microbiome of WT or fat-1 mice and fed CTL or HF diet
