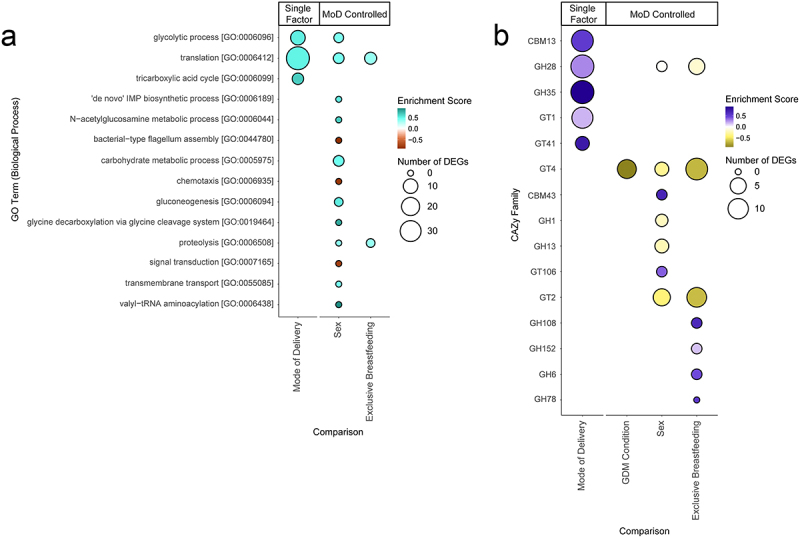
Figure 5.

Bubble charts detailing each Gene Ontology (GO) biological process term and carbohydrate-active enzyme (CAZy) family that was significantly enriched in our differential expression results. Enriched terms were identified using the fgsea R package.35 Size of bubble indicates the number of DEGs from a given functional category associated with the factor. Enrichment score indicates degree and direction of enrichment for a given term. GO terms and CAZy families are sorted by adjusted p-value. Mode of delivery (MoD) controlled terms are indicated. (a) Bubble chart of GO term enrichment. MoD-controlled GDM condition is omitted as there were no significant terms. (b) Bubble chart of CAZy enzymes. CBM = Carbohydrate-Binding Modules, GH = Glycoside Hydrolases, GT = GlycosylTransferases.
