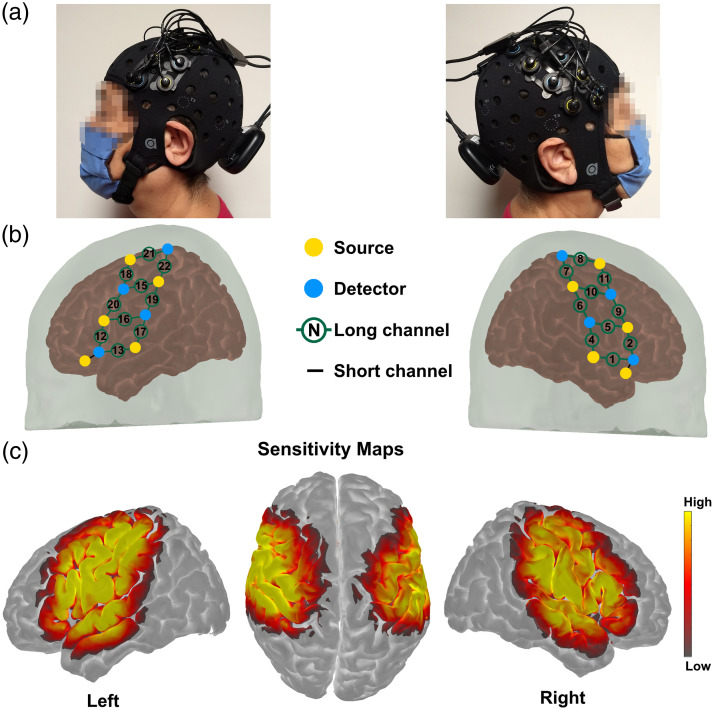
Fig. 1.
(a) Photographs of optode array placement on one participant’s head. (b) Registered probe geometry: yellow dots indicate the 10 sources, and cyan dots specify the eight detectors. Black numbers in green circles indicate long separation channels, and the black lines denote SSCs. (c) Sensitivity profile displayed in a log10 scale.

