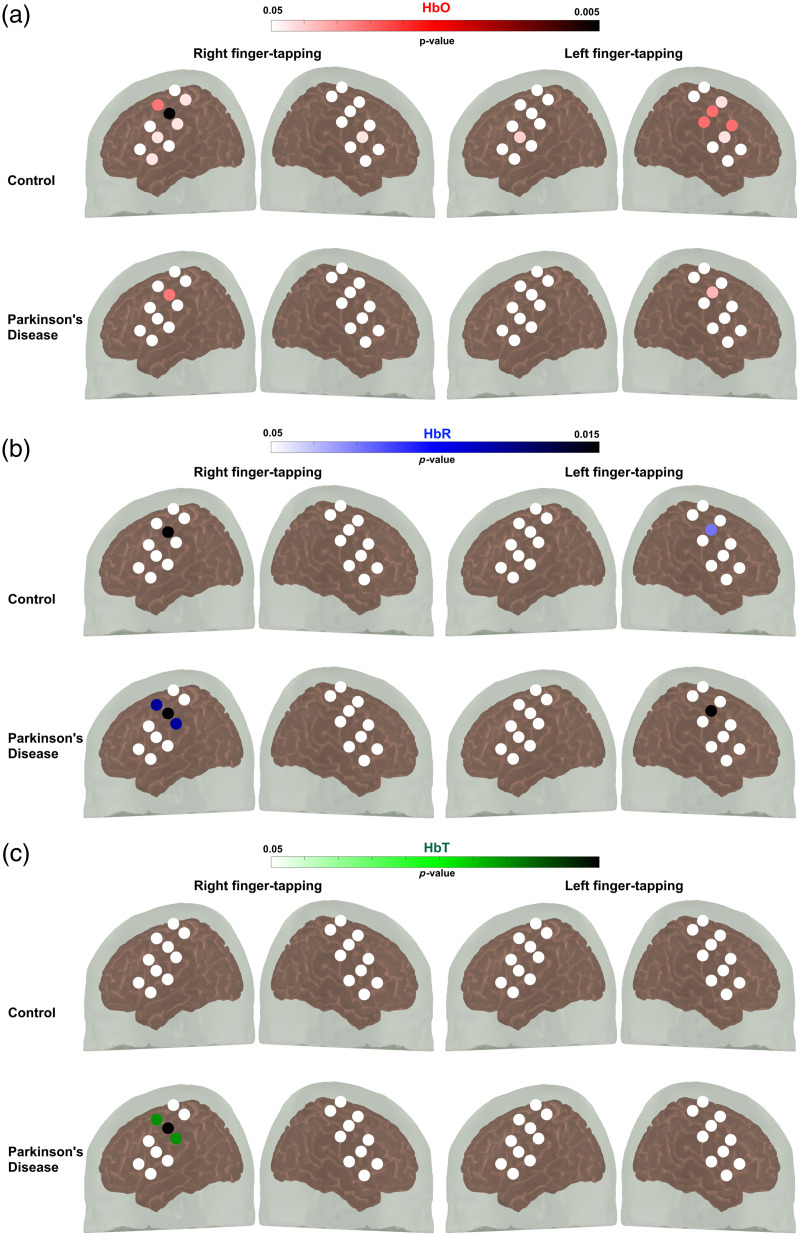
Fig. 3.
Paired sample -test was used to compare the mean change in hemoglobin during the pre-task baseline period and the task period to assess channel activation. The color gradient indicates the -value during the finger-tapping task. Channels in white demonstrate no statistically significant variations in hemoglobin levels between the pre-task baseline and task periods. (a) Oxyhemoglobin (HbO), (b) deoxyhemoglobin (HbR), and (c) total hemoglobin (HbT).

