Fig. 8.
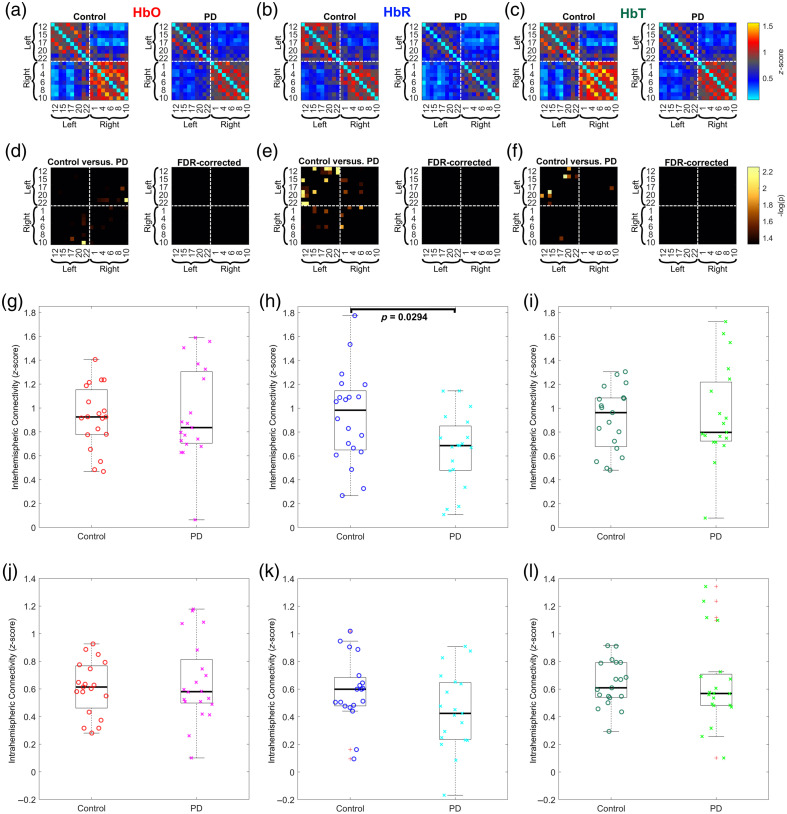
FC: (a)–(c) Color-coded average FC matrices (Fisher’s -score) between channels for both groups calculated for HbO, HbR, and HbT, respectively. Warm colors denote positive correlations, and cold colors denote negative correlations. (d)–(f) Statistical comparison between controls and PD patients. Only statistically significant correlations are shown (). After the FDR correction, no significant differences were found. (g)–(i) Group comparison of interhemispheric connectivity computed for HbO, HbR, and HbT, respectively. A statistically significant decrease in interhemispheric connectivity in PD patients compared with controls was found in HbR measurements. (j)–(l) Group comparison of intrahemispheric connectivity computed for HbO, HbR, and HbT, respectively.

