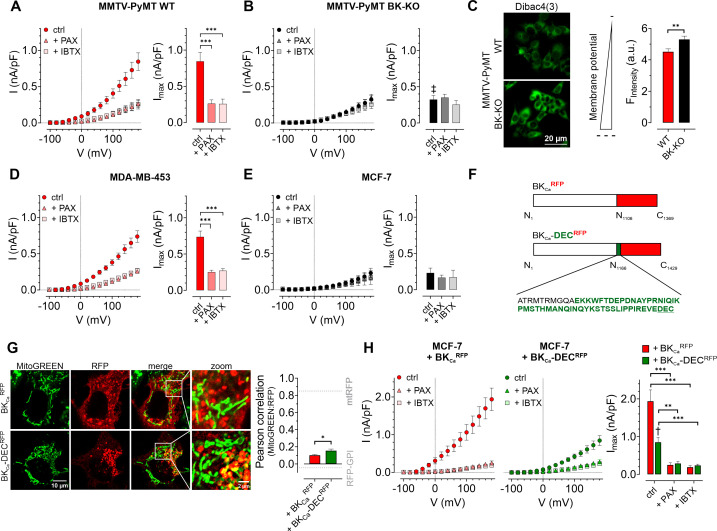
Figure 1. Characterization of BKCa channels in murine and human BCCs.
(A, B) I-V curves (left) and corresponding maximal currents (right) of MMTV-PyMT WT (A) and MMTV-PyMT BK-KO (B) cells, either under control conditions, or in the presence of paxilline or iberiotoxin. Data represents average ± SEM. n (cells) = 15 WT ctrl, 17 WT +PAX, 17 WT +IBTX, 16 BK-KO ctrl, 17 BK-KO +PAX, 19 BK-KO +IBTX. ***p≤0.001, Brown-Forsythe and Welch ANOVA test followed by Games-Howell’s multiple comparison test. ‡P≤0.001 compared to respective WT condition, Welch’s t-test. (C) Representative fluorescence images (left) and statistics (right) of MMTV-PyMT WT and BK-KO cells loaded with the ΔΨPM sensitive dye Dibac4(3). N = 6 independent experiments, **p≤0.01, Unpaired t-test. (D) I-V curves (left) and maximal currents (right) of MDA-MB-453 cells, either under control conditions, or in the presence of paxilline or iberiotoxin. Data represents average ± SEM. n (cells) = 30 ctrl, 22 +PAX, 24 +IBTX. ***p≤0.001, Kruskal-Wallis test followed by Dunn’s multiple comparison test. (E) I-V curves (left) and maximal currents (right) of MCF-7 cells, either under control conditions, or in the presence of paxilline or iberiotoxin. Data shows average ± SEM. n (cells) = 16 ctrl, 20 +PAX, 15 +IBTX. (F) Schematic representation of constructs used for over-expression in MCF-7 cells. The DEC exon is indicated in green. (G) Representative images (left) of MCF-7 cells either expressing BKCaRFP (upper) or BKCa-DECRFP (lower), additionally stained with MitoGREEN. Average Pearson correlations ± SEM of MitoGREEN and RFP of BKCa or BKCa-DEC are shown. n (cells) = 17 BKCa-RFP, 22 BKCa-DECRFP. *p≤0.05, Unpaired t-test. (H) I-V curves (left and middle) and corresponding maximal currents (right) of MCF-7 cells expressing BKCaRFP (left) or BKCa-DECRFP (middle), respectively, either under control conditions, or in the presence of paxilline or iberiotoxin. Data represents average ± SEM. n (cells) = 18 BKCaRFP ctrl, 14 BKCaRFP +PAX, 19 BKCaRFP +IBTX, 18 BKCa-DECRFP ctrl, 21 BKCa-DECRFP +PAX, 18 BKCa-DECRFP +IBTX. **P≤0.01, ***p≤0.001, Brown-Forsythe and Welch ANOVA test followed by Games-Howell’s multiple comparison test. †p≤0.01 between ctrl conditions, Welch’s t-test.


