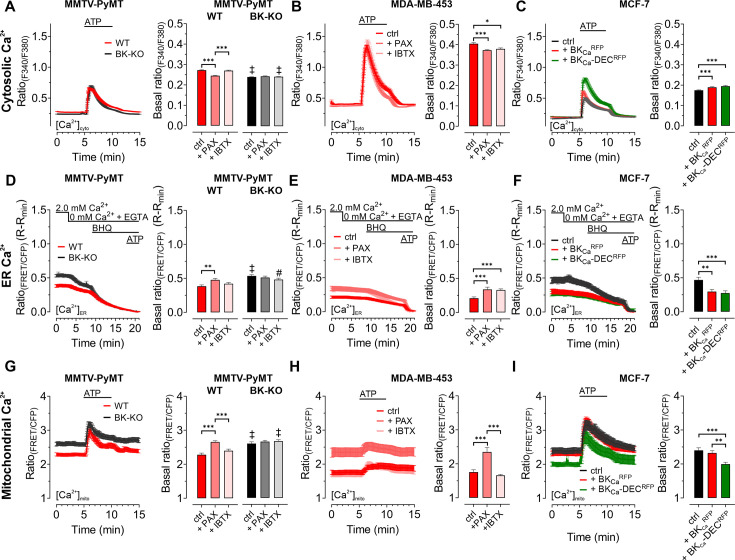
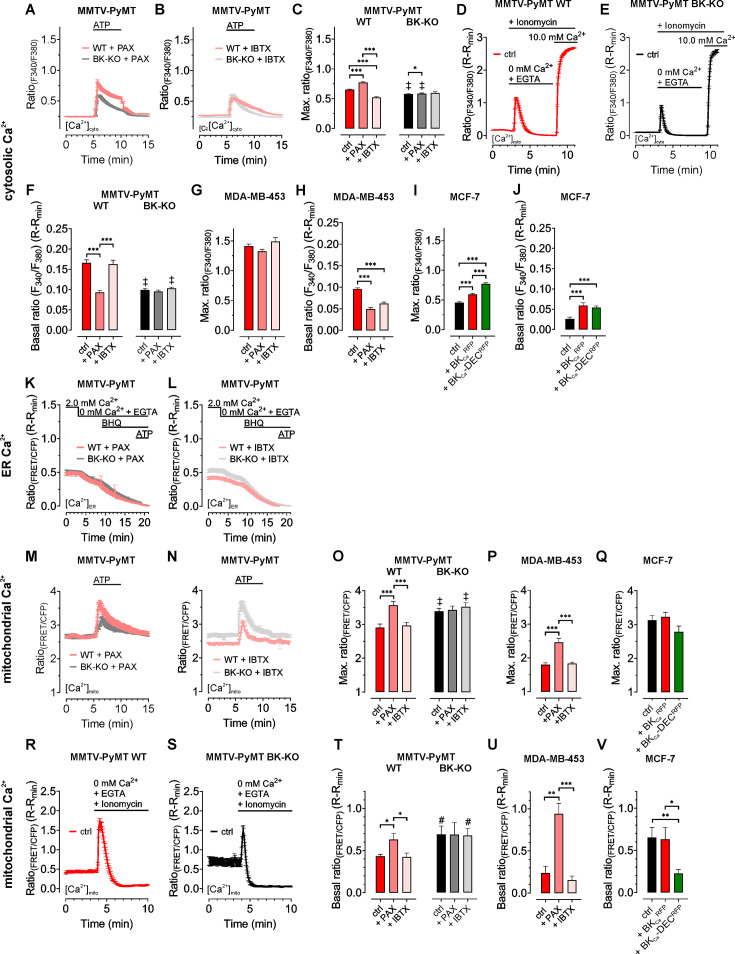
(A, B) Fura-2 ratio signals (F340/F380) of MMTV-PyMT WT or BK-KO cells over-time in response to cell stimulation with 100 µM ATP. Experiments were either performed in the presence of 5 µM paxilline (A) or 30 nM iberiotoxin (B). (C, G, I) Maximal fura-2 ratio signals of MMTV-PyMT WT and BK-KO (C), MDA-MB-453 (G) or MCF-7 cells (I) upon stimulation with 100 µM ATP, under control conditions, in the presence of 5 µM paxilline or 30 nM iberiotoxin (C, G), or upon expression of BKCaRFP or BKCa-DECRFP (I). (D, E) Fura-2 ratio signals ± SEM over-time of MMTV-PyMT WT and BK-KO cells. At time points indicated in the panels, cells were treated with 5 µM ionomycin for Ca2+ permeabilization, Ca2+ was removed and chelated using EGTA, or 10.0 mM of Ca2+ were re-added for Fura-2 saturation. (F, H, J) Basal Fura-2 ratio signals (R-Rmin) ± SEM of MMTV-PyMT WT and BK-KO cells (F), MDA-MB-453 (H) and MCF-7 cells (J) received from experiments as demonstrated in (D) and (E). (K, L) FRET-ratio signals over-time of MMTV-PyMT WT and BK-KO cells expressing D1ER, a FRET-based ER Ca2+ sensor. Throughout the experiments, either 5 µM paxilline (F) or 30 nM iberiotoxin (G) were present. (M, N) [Ca2+]mito over-time of MMTV-PyMT WT or BK-KO cells in response to cell stimulation with 100 µM ATP. [Ca2+]mito was assessed using 4mtD3cpV, a FRET-based Ca2+ indicator targeted to the mitochondrial matrix. Experiments were either performed in the presence of 5 µM paxilline (M) or 30 nM iberiotoxin (N). (O – Q) Maximal FRET-ratio (FRET/CFP) signals received upon stimulation of MMTV-PyMT WT or BK-KO (O), MDA-MB-453 (P) or MCF-7 cells (Q) with 100 µM ATP. Experiments were either performed under control conditions, in the presence of 5 µM paxilline or 30 nM iberiotoxin (O, P), or upon expression of BKCaRFP or BKCa-DECRFP (Q). (R, S) FRET-ratio signals over-time of MMTV-PyMT WT and BK-KO cells expressing 4mtD3cpV, a FRET-based mitochondrial Ca2+ sensor. At time point indicated in the panels, cells were treated with 5 µM ionomycin for Ca2+ permeabilization, and Ca2+ was removed and chelated using EGTA. (T – V) Basal FRET-ratio signals (R-Rmin) of MMTV-PyMT WT and BK-KO cells (T), MDA-MB-453 (U) and MCF-7 cells expressing 4mtD3cpV (V) received from experiments as demonstrated in (R) and (S). All data represent average ± SEM. N (independent experiments) / n (cells analyzed) = (A): 6/300 WT +PAX, 6/300 BK-KO +PAX, (B): 5/318 WT +IBTX, 5/304 BK-KO +IBTX, (C): 17/784 WT ctrl, 18/857 BK-KO ctrl, 6/300 WT +PAX, 6/300 BK-KO +PAX, 5/318 WT +IBTX, 5/304 BK-KO +IBTX, (D): 3/109 WT ctrl, (E): 3/93 BK-KO ctrl, (F): 3/109 WT ctrl, 3/110 WT +PAX, 3/123 WT +IBTX, 3/93 BK-KO ctrl, 3/94 BK-KO +PAX, 3/111 BK-KO +IBTX, (G): 4/151 ctrl, 4/132 +PAX, 4/87 +IBTX, (H): 3/106 ctrl, 3/107 +PAX, 3/109 +IBTX, (I): 5/111 ctrl, 5/117 +BKCaRFP, 5/91 +BKCa-DECRFP, (J): 4/53 ctrl, 5/34 +BKCaRFP, 5/36 +BKCa-DECRFP, (K): 8/71 WT +PAX, 8/92 BK-KO +PAX, (L): 6/102 WT +IBTX, 6/86 BK-KO +IBTX, (M): 6/46 WT +PAX, 6/58 BK-KO +PAX, (N): 5/59 WT +IBTX, 4/43 BK-KO +IBTX, (O): 11/47 WT ctrl, , 6/46 WT +PAX, 5/59 WT +IBTX, 12/86 BK-KO ctrl, 6/58 BK-KO +PAX, 4/43 BK-KO +IBTX, (P): 8/33 ctrl, 8/28 +PAX, 5/22 +IBTX, (Q): 5/28 ctrl, 4/27 +BKCaRFP, 4/24 +BKCa-DECRFP, (R): 3/19 WT ctrl, (S): 3/12 BK-KO ctrl, (T): 3/19 WT ctrl, 3/23 WT +PAX, 3/22 WT +IBTX, 3/12 BK-KO ctrl, 3/17 BK-KO +PAX, 3/14 BK-KO +IBTX, (U): 6/16 ctrl, 6/19 +PAX, 6/19 +IBTX, (V): 5/21 ctrl, 4/10 +BKCaRFP, 4/11 +BKCa-DECRFP. *p≤0.05, **p≤0.01, ***p≤0.001, Kruskal-Wallis test followed by Dunn’s MC test (C, H, I, J, T, U), One-Way ANOVA test followed by Tukey’s MC test (I, O) or Brown-Forsythe and Welch ANOVA test followed by Games-Howell’s MC test (P, V). #p≤0.05, ‡p≤0.001 compared to respective WT condition, Mann-Whitney test (H, O, ctrl in C, +IBTX in T), Welch’s t-test (+PAX in C, ctrl in T). Unpaired t-test (+IBTX in O).
Figure 2—figure supplement 1—source data 1. Numerical values underlying the data shown in Figure 2.


