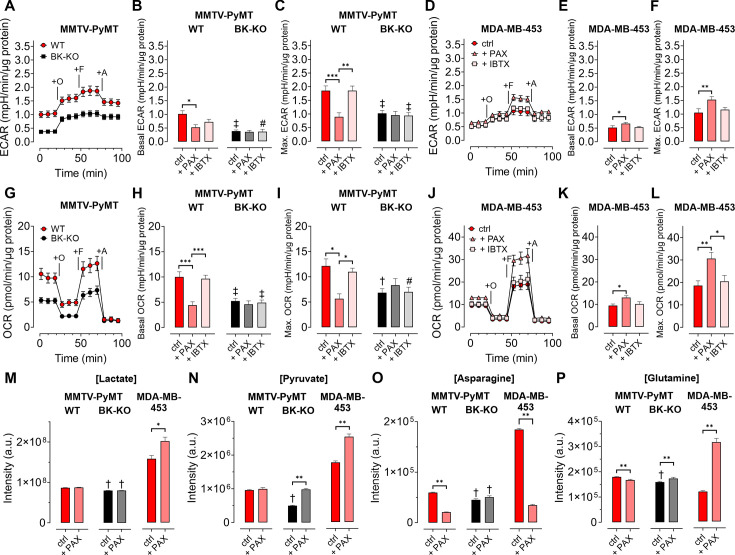
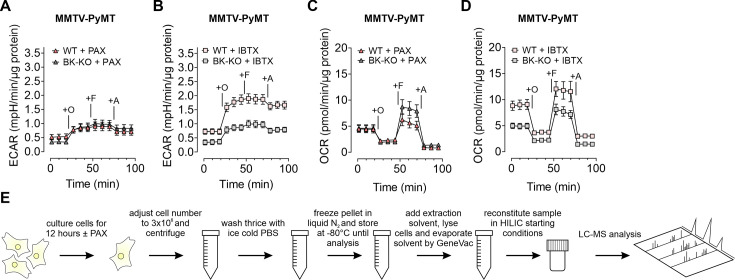
Figure 3. BKCa channels alter the metabolic activity of BCCs.
(A, D) Average ECAR over-time ± SEM of MMTV-PyMT WT (A, red) and BK-KO cells (A, black), or MDA-MB-453 cells (D) in response to administration of Oligomycin-A (+O), FCCP (+F) and Antimycin-A (+A) at time points indicated. (B, E) Average basal and (C, F) maximal ECAR ± SEM of MMTV-PyMT WT (B, C, left) and BK-KO cells (B, C, right), or MDA-MB-453 cells (E, F) under control conditions, or in the presence of paxilline or iberiotoxin. (G, J) Average OCR over-time ± SEM of MMTV-PyMT WT (G, red) and BK-KO cells (G, black), or MDA-MB-453 cells (J) in response to administration of Oligomycin-A (+O), FCCP (+F) and Antimycin-A (+A) at time points indicated. (H, K) Average basal and (I, L) maximal OCR ± SEM of MMTV-PyMT WT (H, I, left) and BK-KO cells (H, I, right), or MDA-MB-453 cells (K, L) under control conditions, or in the presence of paxilline or iberiotoxin. (M – P) LC-MS-based determination of major glycolytic and mitochondrial metabolites in particular Lactate [Lactate]; (M), Pyruvate [Pyruvate]; (N), Asparagine [Asparagine]; (O), and Glutamine [Glutamine]; (P), of MMTV-PyMT WT (left panels), BK-KO (middle panels) and MDA-MB-453 cells (right panels), either under control conditions or after cell cultivation with paxilline. N (independent experiments) = (A, B, C, G, H, I): 7 WT ctrl and BK-KO, 3 for all others, (D, E, F, J, K, L): 3 for all, (M – P): 7 for BK-KO ctrl, 6 for all others. *p≤0.05, **p≤0.01, ***p≤0.001, Kruskal-Wallis test followed by Dunn’s MC test (B, E, F, I), Brown-Forsythe and Welch ANOVA test followed by Games-Howell’s MC test (C, H), One-Way ANOVA test followed by Tukey’s MC test (K, L) or Mann-Whitney test (M – P). #p≤0.05, †p≤0.01, ‡p≤0.001, to respective WT condition, Mann-Whitney test (B, C) +IBTX in (I), (M – P), Welch’s t-test (ctrl in H) and (I) or Unpaired t-test (+IBTX in H).


