. 2024 May 29;12:RP92511. doi: 10.7554/eLife.92511

Figure 4. Expression of BKCa modulates mitochondrial function and glucose uptake of BCCs.

(A – D) Representative fluorescence images and -ratios (Fmito/Fnuc) over-time (A, C), and corresponding statistics ± SEM (B, D) representing ΔΨmito of TMRM-loaded MMTV-PyMT WT and BK-KO (A, B) and MDA-MB-453 cells (C, D) under basal conditions (A, C, upper images) and upon administration of FCCP for mitochondrial depolarization (A, C, lower images). (E – J) [ATP]mito dynamics ± SEM over-time of MMTV-PyMT WT and BK-KO cells (E), MDA-MB-453 cells (G) and MCF-7 cells (I) in response to extracellular glucose removal (left panels) or upon administration of Oligomycin-A (right panels). (F, H) and (J) show changes of [ATP]mito induced by glucose removal to Oligomycin-A administration ± SEM, under control conditions, or in the presence of paxilline or iberiotoxin (F, H), or upon expression of BKCaRFP or BKCa-DECRFP (J). (K – M) Basal mitochondrial H2O2 concentrations ± SEM of MMTV-PyMT WT (K, left), BK-KO (K, right), MDA-MB-453 (L) and MCF-7 cells (M), either under control conditions, in the presence of paxilline or iberiotoxin (K, L), or upon expression of BKCaRFP or BKCa-DECRFP (M). (N, P) Representative fluorescence wide-field images (left) and corresponding statistics ± SEM (right) of MMTV-PyMT WT (N, left images and red bars) and BK-KO cells (N, right images and black bars) or MDA-MB-453 cells (P) incubated with 2-NBDG, either in the absence (upper images) or presence of FCCP (lower images). (O, Q) Average ± SEM of FCCP induced change in 2-NBDG uptake of MMTV-PyMT WT (O, left) and BK-KO cells (O, right), or MDA-MB-453 cells (Q) either under control conditions, or in the presence of paxilline or iberiotoxin. Values above 1 indicate that mitochondria prevent, values below 1 that mitochondria support glucose uptake. N (independent experiments) / n (cells analyzed) = (A, B): 4/75 WT ctrl, 4/90 WT +PAX, 4/86 WT +IBTX, 4/91 BK-KO ctrl, 4/89 BK-KO +PAX, 4/100 BK-KO +IBTX, (C, D): 4/113 ctrl, 4/97+PAX, 4/103+IBTX, (E, F): [-Glucose]: 8/55 WT ctrl, 6/45 WT +PAX, 7/27 WT +IBTX, 8/65 BK-KO ctrl, 6/57 BK-KO +PAX, 7/28 BK-KO +IBTX, [+Oligomycin-A]: 11/52 WT ctrl, 7/53 WT +PAX, 7/34 WT +IBTX, 8/87 BK-KO ctrl, 6/35 BK-KO +PAX, 5/45 BK-KO +IBTX. (G, H): [-Glucose]: 5/14 ctrl, 3/13+PAX, 5/13+IBTX, [+Oligomycin-A]: 5/33 ctrl, 3/21+PAX, 8/27+IBTX, (I, J): [-Glucose]: 6/48 ctrl, 5/23+BKCaRFP, 5/20+BKCa-DECRFP, [+Oligomycin-A]: 5/27 ctrl, 5/23+BKCaRFP, 5/37+BKCa-DECRFP, (K): 3/33 WT ctrl, 4/51 WT +PAX, 4/54 WT +IBTX, 4/55 BK-KO ctrl, 4/51 BK-KO +PAX, 4/54 BK-KO +IBTX, (L): 4/31 ctrl, 4/39+PAX, 4/31+IBTX, (M): 4/29 ctrl, 4/17+BKCaRFP, 4/21+BKCa-DECRFP, (N – Q): 4 for all. *p≤0.05, **p≤0.01, ***p≤0.001, Kruskal-Wallis test followed by Dunn’s MC test (B, D, F, H, J, K, O), Brown-Forsythe and Welch ANOVA test followed by Games-Howell’s MC test (L, M), Mann-Whitney test (N), Unpaired t-test (P) or Welch’s t-test (Q). #p≤0.05, †p≤0.01, ‡p≤0.001, to respective WT condition, Mann-Whitney test (B, F) +PAX and+IBTX in (K) ctrl in (O), Unpaired t-test (ctrl in K) +PAX and+IBTX in (O).

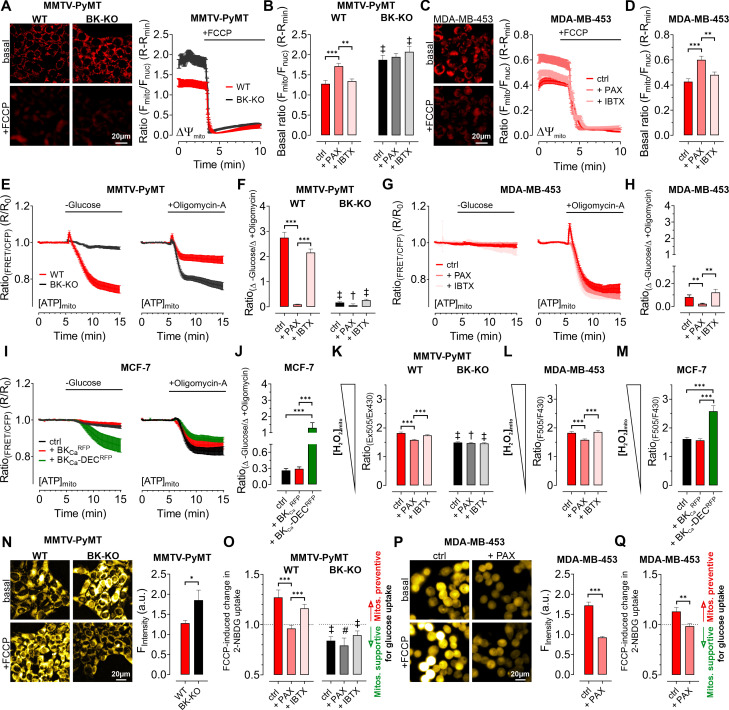
Figure 4—source data 1. Numerical values underlying the data shown in Figure 4.
elife-92511-fig4-data1.xlsx (267.7KB, xlsx)

Figure 4.

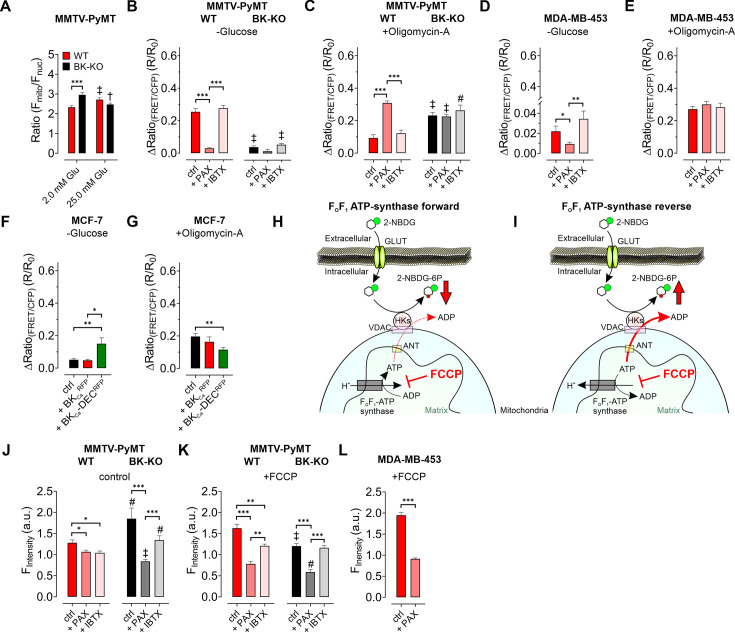
Figure 4—figure supplement 1. BKCa modulates cellular substrate dependency for maintaining [ATP]mito and reverses FOF1 ATP-synthase.

Figure 4—figure supplement 1.

(A) Average fluorescence ratios (Fmito/Fnuc) of MMTV-PyMT WT and BK-KO cells, either in the presence of 2.0 mM or 25.0 mM extracellular glucose. N (independent experiments) / n (cells analyzed) = 6/171 WT 2.0 mM Glu, 6/180 WT 25.0 mM Glu, 5/133 BK-KO 2.0 mM Glu, 6/163 BK-KO 25.0 mM Glu. ***p≤0.001, Mann-Whitney test. †p≤0.01, ‡p≤0.001 compared to 2.0 mM glucose condition of the respective cell type, Mann-Whitney test. (B – E) Average changes in FRET-ratio signals ± SEM induced either upon extracellular glucose removal (B, D) or upon administration of Oligomycin-A (C, E) to MMTV-PyMT WT, BK-KO (B, C) or MDA-MB-453 cells (D, E) expressing mtAT1.03, a FRET-based ATP sensor targeted to the mitochondrial matrix. Experiments were either performed under control conditions or in the presence of 5 µM paxilline or 30 nM iberiotoxin. N/n = (B): 8/55 WT ctrl, 6/45 WT +PAX, 7/27 WT +IBTX, 8/65 BK-KO ctrl, 6/57 BK-KO +PAX, 7/28 BK-KO +IBTX, (C): 11/52 WT ctrl, 7/53 WT +PAX, 7/34 WT +IBTX, 8/87 BK-KO ctrl, 6/35 BK-KO +PAX, 8/45 BK-KO +IBTX, (D): 5/14 ctrl, 3/13+PAX and 5/13+IBTX, (E): 5/33 ctrl, 3/21+PAX, 8/27+IBTX. *p≤0.05, **p≤0.01, ***p≤0.001, Kruskal-Wallis test followed by Dunn’s MC test (B, C, D). #p≤0.05, ‡p≤0.001 compared to respective WT condition, Mann-Whitney test (ctrl in B), all in C, or Welchs t-test (+IBTX in B). (F, G) Average changes in FRET-ratio signals ± SEM induced either upon extracellular glucose removal (F) or upon administration of Oligomycin-A (G) to MCF-7 cells expressing mtAT1.03, either in combination with a red fluorescent protein as control, or BKCaRFP or BKCa-DECRFP, respectively *p≤0.05, **p≤0.01, Kruskal-Wallis test followed by Dunn’s MC test. N/n = (F): 6/48 ctrl, 5/23+BKCaRFP, 5/20+BKCa-DECRFP, (G): 5/27 ctrl, 5/23+BKCaRFP, 5/37+BKCa-DECRFP. (H, I) Schematic representation of processes involved in 2-NBDG uptake. 2-NBDG is taken up via glucose transporters (GLUTs, green), and ATP-dependently phosphorylated by hexokinase isoforms (HKs, red) to 2-NBDG-6-phosphate (2-NBDG-6P). Under basal conditions, if FOF1 ATP-synthase is running in forward mode (H), mitochondria contribute to 2-NBDG uptake by ATP generation and delivery to HKs via the adenine nucleotide transporter (ANT, yellow), and the voltage-dependent anion channel (VDAC, violet). Contrary, under basal conditions, if FOF1 ATP-synthase activity is reversed (I) it competes with HKs for ATP. Subsequent inhibition of mitochondria due to their depolarization with FCCP (red) stops ATP-synthase activity. Under these conditions, 2-NBDG uptake will decrease if FOF1 ATP-synthase operates in forward mode (H), but will increase if FOF1 ATP-synthase shows reversed activity (I). (J – L) Average fluorescence signal (a.u.) ± SEM of MMTV-PyMT WT and BK-KO cells (J, K), or MDA-MB-453 cells (L) incubated with 100 µM 2-NBDG at 37 °C for 30 min either under control conditions (J) or in the presence of 200 nM FCCP for mitochondrial depolarization (K, L), with or without 5 µM paxilline or 30 nM iberiotoxin. N = 4 for all. *p≤0.05, ***p≤0.001, Kruskal-Wallis test followed by Dunn’s MC test (J), and WT in K, One-Way ANOVA test (BK-KO in K) or Welch’s t-test (L). #p≤0.05, ‡p≤0.001 compared to respective WT condition, Mann-Whitney test (ctrl and +IBTX in J), ctrl in (K), or Unpaired t-test (+PAX in J) and +PAX in (K).
Figure 4—figure supplement 1—source data 1. Numerical values underlying the data shown in Figure 4.