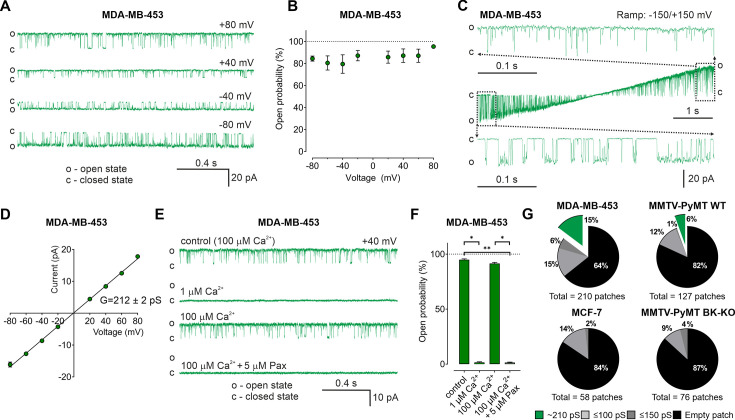
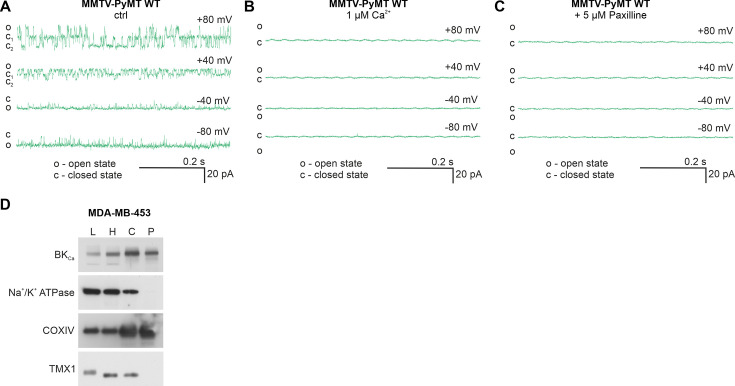
Figure 5. BKCa activity is present in the inner mitochondrial membrane (IMM) of BCCs.
(A) Representative BKCa single-channel recordings of the IMM of mitoplasts isolated from MDA-MB-453 cells using a symmetric 150/150 mM isotonic KCl solution containing 100 µM Ca2+ at voltages ranging from –80 to +80 mV as indicated in the panel. (B) Open probability analysis of mitoBKCa at different voltages received from experiments as performed in (A). N = 8. (C) Single-channel currents of the IMM of mitoplasts isolated from MDA-MB-453 cells recorded using a voltage ramp protocol ranging from −150 to +150 mV. Above and below the ramp are enlarged excerpts of the records shown in rectangles. (D) Current-voltage (I–V) plot based on single-channel recordings of MDA-MB-453 cells as performed in (A), using a symmetric 150/150 mM KCl isotonic solution containing 100 µM Ca2+. N = 11. (E, F) Representative single-channel recordings of the IMM of mitoplasts isolated from MDA-MB-453 cells (E) and corresponding open probabilities at +40 mV in a symmetric 150/150 mM KCl isotonic solution under control conditions (100 μM Ca2+), after reducing Ca2+ to 1 μM, re-addition of 100 μM Ca2+ and finally after application of 5 μM paxilline in the presence of 100 μM Ca2. Data in (F) show average ± SEM. *p≤0.05, **p≤0.01 using Friedmann test followed by Dunn’s multiple comparison test, n = 7. (G) Pie chart displaying the percentage of mitoBKCa channel currents (green) possessing a conductance of ~210 pS, versus the total number of patch-clamp experiments performed using mitoplasts isolated from MDA-MB-453 cells (upper left), MMTV-PyMT WT cells (upper right), MCF-7 cells (lower left), and MMTV-PyMT BK-KO cells (lower right). Black segments represent empty patches, bright- and dark grey fraction demonstrate percentage of channels possessing smaller conductances of ≤100 pS and ≤150 pS, respectively. All recordings were low-pass filtered at 1 kHz. ‘c’ and ‘o’ indicate the closed- and open state of the channel, respectively.


