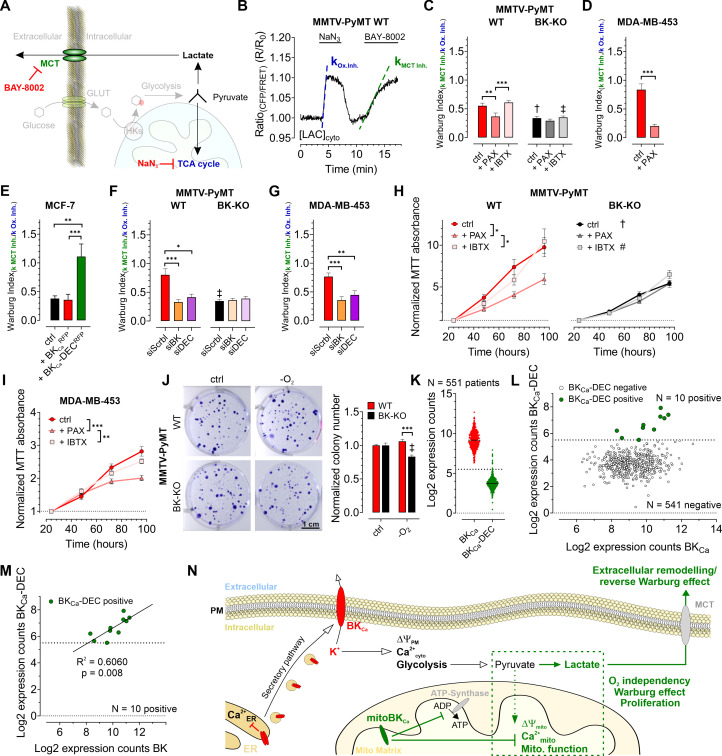
Figure 6. BKCa-DEC expression contributes to the metabolic remodeling and growth of murine and human BCCs and is present in primary tumor samples.
(A) Schematic representation of the fate of glucose in glycolysis. The tricarboxylic acid (TCA) cycle or lactate secretion via monocarboxylate transporters (MCT) can be inhibited, either using NaN3 or BAY-8002. GLUT: Glucose transporter, HKs: Hexokinases. (B) Representative cytosolic lactate concentration ([LAC]cyto) of a MMTV-PyMT WT cell over-time in response to administration or removal of NaN3 and BAY-8002 at time points indicated. Dashed lines indicate slopes taken for assessment of the ‘Warburg index’. (C – G) Average Warburg indices ± SEM of MMTV-PyMT WT (C, F, left), MMTV-PyMT BK-KO (C, F, right), MDA-MB-453 cells (D, G) and MCF-7 cells (E) calculated from the experiments as shown in (B), either under control conditions, in the presence of paxilline or iberiotoxin (C, D), upon expression of BKCaRFP or BKCa-DECRFP (E), or upon cell treatment with a scrambled siRNA (siScrbl), or siRNA against a common BKCa sequence targeting all known splice variants (siBK), or a siRNA specifically designed to knockdown BKCa-DEC (siDEC) (F, G). (H, I) Normalized MTT absorbance over-time of MMTV-PyMT WT (H, left) and BK-KO cells (H, right), and MDA-MB-453 cells (I), either under control conditions, or in the presence of paxilline or iberiotoxin. (J), Representative images and corresponding statistics of colony formation assays using MMTV-PyMT WT or BK-KO cells in the presence or absence of O2. (K – N) mRNA expression of BKCa and BKCa-DEC as performed by Nanostring analysis of 551 BC patient samples. (K) Log2 expression counts of BKCa and BKCa-DEC. The threshold for positive expression level was set to log2 = 5.5 (dashed line). (L) Log2 expression counts of BKCa-DEC blotted over the log2 expression counts of BKCa. 10 of the 551 patient samples showed expression of BKCa-DEC above the threshold of log2 = 5.5 (dashed line), whereas 541 patient samples were BKCa-DEC negative. (M) Correlation of the log2 expression counts of BKCa-DEC positive samples with the log2 expression counts of BKCa in the primary human BC material. (N) Summarizing scheme of BKCa in cancer cell homeostasis. N (independent experiments) / n (cells analyzed) = (C): 4/26 WT ctrl, 6/28 WT +PAX, 4/39 WT +IBTX, 4/17 BK-KO ctrl, 5/18 BK-KO +PAX, 4/27 BK-KO +IBTX, (D): 7/29 ctrl, 5/13+PAX, (E): 5/27 ctrl, 5/20+BKCaRFP, 7/26 BKCa-DECRFP, (F): 5/22 WT siScrbl, 5/28 WT siBK, 4/26 WT siDEC, 5/24 BK-KO siScrbl, 5/24 BK-KO siBK, 5/29 BK-KO siDEC, (G): 5/21 siScrbl, 5/22 siBK, 5/19 siDEC, (H – J): 4 for all. *p≤0.05, **p≤0.01, ***p≤0.001, Kruskal-Wallis test followed by Dunn’s MC test (C, E, F, G, I), One-Way ANOVA test followed by Tukey’s MC test (H) or Mann-Whitney test (D). †p≤0.01, ‡p≤0.001 compared to respective WT condition, Unpaired t-test ctrl, (C, J) or Mann-Whitney test (+IBTX, C, F).


