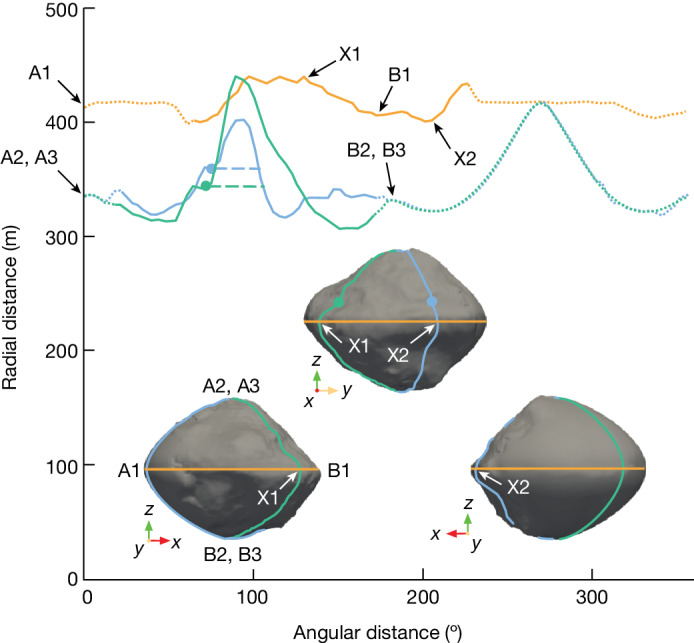
Fig. 3. The shape model of Dinkinesh.

Three orientations (insets) and topographic cuts designed to emphasize the structure of the equatorial ridge. The model, which is described in the ‘Shape’ section in Methods, consists of two regions. The side of the model that was facing Lucy during the encounter was based on the images taken during the close-approach imaging campaign (see the ‘Observations’ section in Methods). The unilluminated portion of Dinkinesh is estimated with a super-ellipsoid. The rotational (z) axis points up in these figures. The orange curve shows a latitudinal cut that lies along the ridge. The blue and green curves are longitudinal cuts corresponding to the minimum and maximum elevations of the equatorial ridge, respectively. The points labelled X1 and X2 indicate where the green and blue curves cross the orange curve, respectively. The dots show the location of the ridge’s northern boundary, as determined visually in Fig. 1a (the corresponding blue and green arrows) and the horizontal dashed lines show the extent of the ridge. The ridge at its lowest point measures 150 m wide and 40 m high, whereas it is 230 m wide and 100 m high at its highest point. The curves are solid in the locations in which the shape model is reliable, whereas they are dotted elsewhere. The reference locations labelled A1, A2, A3, B1, B2, B3, X1 and X2 are included to allow the reader to associate the shape model to the curves.
