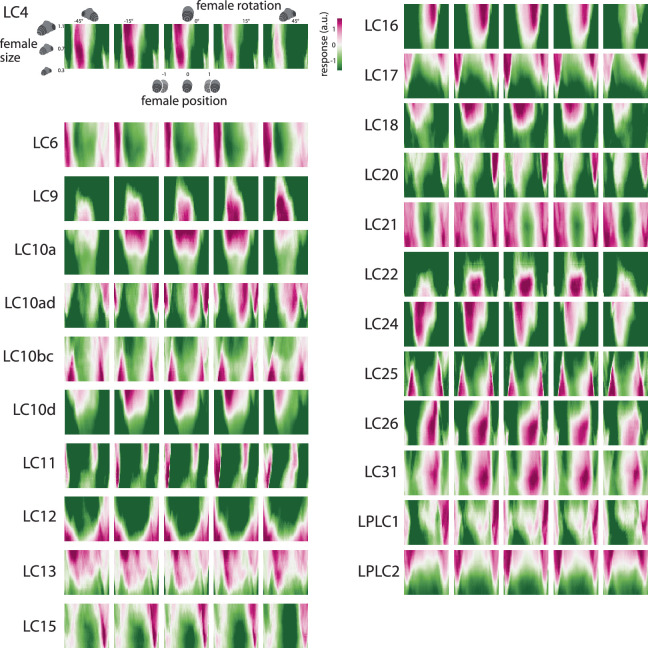
Extended Data Fig. 9. Model LC tuning heat maps.
Each “pixel” in the heatmap corresponds to the response of the model LC unit to one input stimulus sequence in which a static fictive female fly has a given size, position, and rotation (i.e., all 10 images of the input sequence were the same, see Methods). We then systematically varied female size, position, and rotation across stimulus sequences (125,000 sequences in total). Same format as in Fig. 3c,d but for all model LC units.

