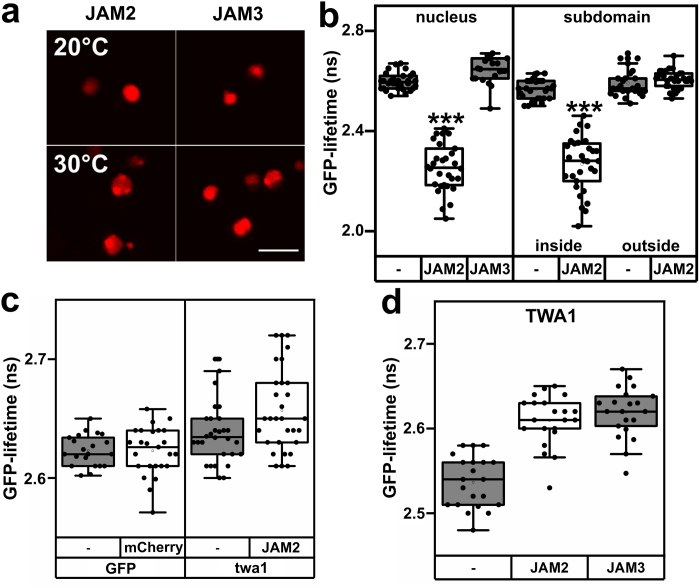
Extended Data Fig. 6. Analysis of JAM2 and JAM3 in yeast.
a, Fluorescence of mCherry-tagged JAM2 and JAM3 in yeast nuclei at 20 °C (Top) and 30 °C (Bottom). Scale bar 5 µm. b, FRET-FLIM analysis of GFP-TWA1 with mCherry-tagged acceptor proteins JAM2, JAM3, or no acceptor (−) at 30 °C in the yeast nucleus. Reduction of TWA1 fluorescence lifetime by JAM2 expression indicates proximity of the proteins which occurred within nuclear subdomains (see a). Asterisks indicate a significant difference (JAM2, nucleus, P = 0.009; JAM2, inside subdomain, P = 0.008; two-sided Mann-Whitney U test, 20-30 cells). c, Protein interaction analysis of mCherry-tagged JAM2 with GFP and GFP-twa1 product (twa1). The analysis with non-fused mCherry protein is shown as a control (−). Two-sided Mann-Whitney U-Test, P = 0.82 (JAM2, twa1); P = 0.68 (mCherry, GFP); n = 20−30. d, No detectable interaction of TWA1 with JAM2 at 20 °C in yeast nucleus. FRET-FLIM analysis with GFP-TWA1 (−) and GFP-TWA1 with mCherry-tagged acceptor proteins JAM2 and JAM3 (two-sided Mann-Whitney U-Test, P = 0.24 (JAM2, TWA1); P = 0.07 (JAM3, TWA1); n = 20−30. Box plots as in SI Extended Data Fig. 5. Statistical significance in SI_Extended Fig. 6.

