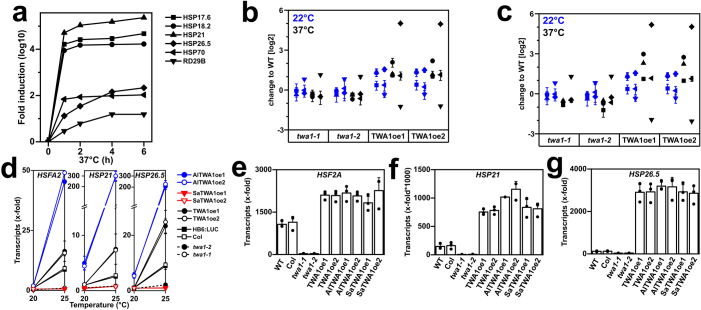
Extended Data Fig. 10. Transcript levels in seedlings expressing TWA1 or TWA1 orthologs in comparison to wild type and twa1 mutants.
a, Left, Changes in transcript abundance for HSPs and ABA-induced RD29B in wild type of 5 days-old seedlings exposed to a shift from 22 °C to 37 °C for up to 6 h. Transcripts were quantified by realtime PCR after 4 h recovery at 22 °C. The transcript level in WT (pHB6:LUC) without heat treatment was set to 1. b, Transcript changes in TWA1-deficient and TWAoe lines compared to WT as in a, with 37 °C exposure for 4 h (treatment and symbols as in a. Transcripts were analysed by RT-PCR). c, Analysis as in b, however, with a recovery time of 0.5 h. d, Transcript changes of HSFA2, HSP21, and HSP26.5 affected by TWA1 and orthologs in 5-d old seedlings from ten different lines grown at 20 °C and exposed for 1 h to 25 °C, or kept at 20 °C, with 0.5 h recovery period at 20 °C prior to RT-qPCR analysis. e-g, Transcript abundance in A. thaliana seedlings grown at 20 °C and exposed to 35 °C for 1 h after 30 min recovery at 20 °C that expressed TWA1, the orthologues from A. lyrata AlTWA1 and Sinapis alba SaTWA1 under the control of the viral 35 S promoter in the twa1-2 background. The analysis of two representative lines is shown in comparison to WT lines (pHB6:LUC and Col-0) and both twa1 mutants for e, HSFA2, f, HSP21 and g, HSP26.5 transcript levels. The transcript abundance of WT pHB6:LUC line at 20 °C is set to 1. a-g, Data are mean ± s.d., n = 3, ten seedlings per n. Statistical significance in SI_Extended Fig. 10.

