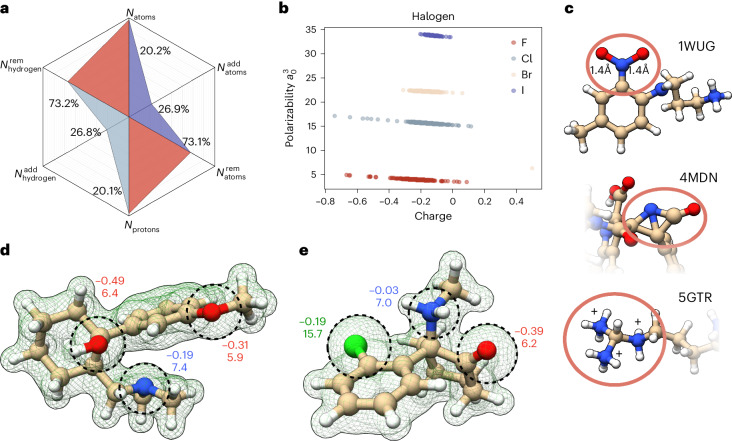
Fig. 2. Changes applied to the PDBbind database based on our quantum chemical protocol.
a, Statistical overview of changes introduced by our optimization protocol. Natoms corresponds to total changes in the atom count when compared with the source database. In most cases atoms were removed ); in only 27% of cases was the number of atoms increased, . Similar considerations apply to protons—light blue; Nprotons. b, D4 polarizability versus partial charge for all the halogens in the database. The outliers were analyzed to find possible wrong atom assignments. This was the case for the bromine atom in the lower right corner, which in reality is a boron. c, Examples of inconsistent structures: 1WUG contains overly elongated NO bonds; 4MDN contains a nitrogen in angular violation of VSEPR; 5GTR shows a typical problem in the protonation state. d,e, Calculated electronic density for ketamine (4G8H) and tramadol, respectively (dashed green lines). Dashed circles show the sizes of electronic density around selected atoms. The numbers next to these atoms represent partial charge (top) and atomic polarizability (bottom). These are electronic descriptors representing the electronic density around each center. Color and character keys: N, blue, nitrogen; S, yellow, sulfur; O, red, oxygen; C, beige, carbon; H, white, hydrogen; Cl, green, chlorine.

