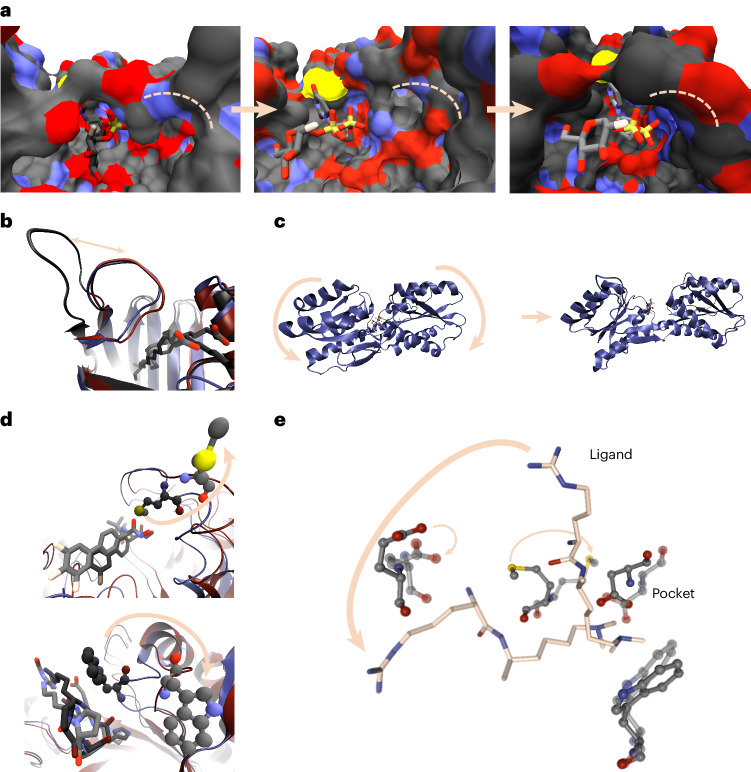
Fig. 3. Overview of events captured by the MD simulations in the binding pocket.
a–c, Reversible opening and closing of the binding pocket can be captured during the simulations, including cryptic binding sites. a, The structure of 2AM4 is shown after 2 ns (left panel), 6 ns (middle panel) and 10 ns (right panel) simulation time (fluorine in beige). b,c, The opening loop region (b, structure 2LKK) is visualized for superimposed timesteps (blue diagram, dark hue, 2 ns; black diagram, medium dark hue, 6 ns; red diagram, light hue, 10 ns). The protein pocket opens in structure 8ABP during the simulation (c). d, Protein residues at the binding site can undergo large adaptations within the simulations, indicating unstable interactions or possible switches. This is shown for a methionine residue of 4ZYZ (upper panel) and a tryptophan residue of 1WAW (lower panel). Coloring as in b after 2 ns and 10 ns. e, MD simulations captured local adaptability of the binding pocket and ligand. That is, in structure 2IG0 parts of the ligand (licorice, carbons in ivory) are quite flexible in the protein pocket (gray carbons) when comparing the first (dark hue) and the last (light hue) frames of the MD run. Color and character keys, if not indicated differently: N, blue, nitrogen; S, yellow, sulfur; O, red, oxygen; C, black, carbon; H, white, hydrogen; F, beige, fluorine; P, orange, phosphorus.

