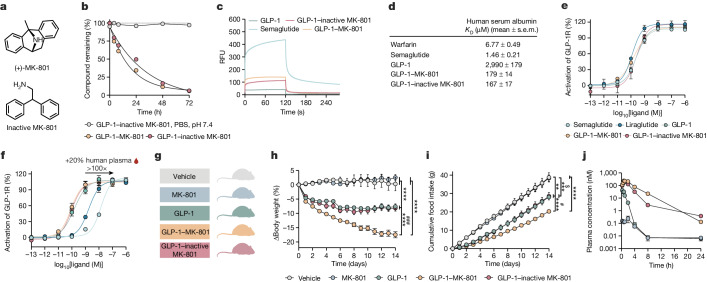
Fig. 2. Pharmacokinetic assessments of GLP-1–MK-801.
a, The chemical structures of (+)-MK-801 and 2,2-diphenylethan-1-amine (inactive MK-801). b, In vitro stability assay of GLP-1–MK-801 (n = 3) and GLP-1–inactive MK-801 (n = 3) incubated in human plasma at 37 °C and GLP-1–MK-801 (n = 1) incubated in PBS buffer, pH 7.4 at 37 °C. c,d, The interactions with human serum albumin of GLP-1, GLP-1–MK-801, GLP-1–inactive MK-801, semaglutide and warfarin were analysed using surface plasmon resonance (n = 3 per compound). c, Sensorgrams measured at 25 µM. RFU, relative fluorescence units. d, Dissociation constants were derived using a multi-site fit model. e,f, Dose–response curves for in vitro GLP-1 receptor activation of GLP-1, GLP-1–MK-801, GLP-1–inactive MK-801, liraglutide and semaglutide (n = 3 per compound). e, Dose–response curves. f, Dose–response curves in the presence of 20% human plasma. g–i, DIO mice were treated once-daily with s.c. injections of MK-801, GLP-1, GLP-1–inactive MK-801 or vehicle for 14 days. n = 8 mice. 100 nmol kg−1 dose. g, Schematic. h, Change in body weight. i, Cumulative food intake. j, The plasma concentration of MK-801, GLP-1, GLP-1–inactive MK-801 and GLP-1–MK-801 in chow-fed male C57BL/6J mice. n = 4 mice per group. 100 nmol kg−1 dose. Data were analysed using two-way repeated-measures ANOVA to assess main effects of treatment (h–j). Dissociation constants were determined using a multi-site fit model (d). Data are mean ± s.e.m. *P < 0.05, **P < 0.01, ***P < 0.001, ****P < 0.0001. #denotes comparison between GLP-1–MK-801 and GLP-1–inactive MK-801. $denotes comparison between vehicle and GLP-1–inactive MK-801. Detailed statistics are provided in Supplementary Table 1. The diagram in g was created using BioRender.

