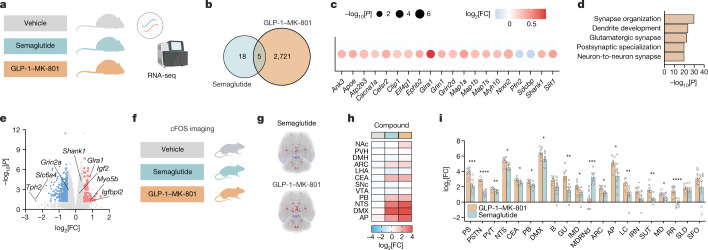
Fig. 5. The effects of GLP-1–MK-801 on the hypothalamic transcriptome and whole-brain activity.
a–e, RNA-seq analysis of hypothalami from DIO mice treated once-daily with s.c. injections of semaglutide (10 nmol kg−1), GLP-1–MK-801 (100 nmol kg−1) or vehicle for 5 days. n = 6 mice. a, Schematic. b, Venn diagram of differentially expressed genes. c, The top 20 most differentially expressed genes found in the top 5 functional terms in d. d, The top 5 functional terms between GLP-1–MK-801 and semaglutide treatments. e, Volcano plot of differentially expressed genes in response to GLP-1–MK-801 relative to semaglutide. f–i, Whole-brain 3D mapping and quantification of cFOS responses to a single s.c. injection with semaglutide (10 nmol kg−1), GLP-1–MK-801 (100 nmol kg−1) or vehicle in lean mice. n = 7–8 mice. One mouse in the GLP-1–MK-801 group was excluded due to sample-processing deviation. f, Schematic. g, Mouse brain images showing a heat map of the averaged changes in cFOS expression in response to treatments. h, Heat map of cFOS activity in brain regions associated with appetite regulation. i, Comparison of changes in cFOS expression in the top 20 most significantly regulated brain regions. Data were analysed using an unpaired two-tailed t-test (i). Data are mean ± s.e.m. *P < 0.05, **P < 0.01, ***P < 0.001, ****P < 0.0001. Definitions of brain region abbreviations are provided in the ‘cFOS whole-brain imaging’ section of the Methods. Detailed statistics are provided in Supplementary Table 1. The diagrams in a, b and f were created using BioRender.

