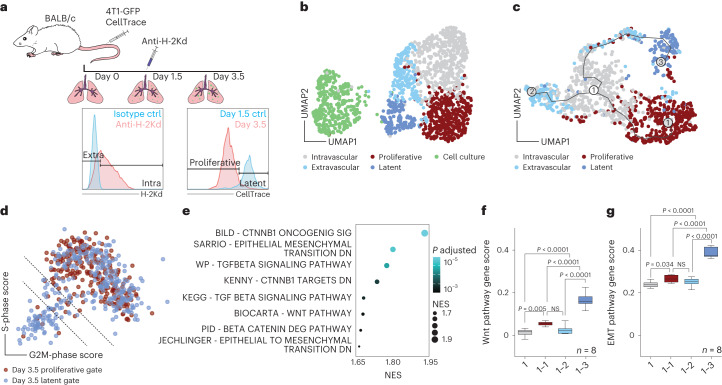
Fig. 1. Extravasation and LTCs are defined by a Wnt and EMT signature.
a, Schematic of the experimental design. Recipient BALB/c mice received two injections of 1 × 10⁶ 4T1-GFP cells stained with CellTrace dye via the tail vein. At day 1.5 postinjection, mice were injected intravenously with 5 µg of fluorescently labeled anti-H-2Kd antibody. TCs and ECs were sampled at day 0 (uninjected baseline), day 1.5 and day 3.5. TCs were discriminated based on both extravasation status on day 1.5 and proliferation status on day 3.5. b, UMAP of total TC dataset, with 1,556 cells passing quality control. SNN-based clustering resolved transcriptomes of TCs into five clusters; n = 4 mice per time point. c, Trajectory analysis of extracted TCs from combined day 1.5 and day 3.5 time points reveals three transition branches; the dataset contains 1,194 cells. d, Scatter plot of S- and G2M-phase gene expression scores for individual cells extracted on day 3.5 and colored by respective FACS gates. Dotted lines indicate thresholds of cells with score sums <−1 (lower line) and <0 (upper line). e, GSEA of genes upregulated in bona fide LTCs, ranked by fold change. Selected gene sets are shown (the full set is displayed in Supplementary Table 2). P values computed by permutation. f,g, Gene scores for Wnt pathway-associated genes (f, 146 genes) and for genes upregulated during EMT transition (g, 384 genes). Analysis of pseudobulks of manually selected TCs along the branches of the trajectory in c and grouped by biological replicate, with pseudobulks reflecting intravascular cells (1), cells on the intravascular–proliferative branch (1–1), cells on the intravascular–extravascular branch (1–2) and cells on the extravascular–latency branch (1–3). P values by one-way analysis of variance (ANOVA) with Tukey post test are shown. Box size represents interquartile range (IQR), with midline representing the median of the data, upper line the upper quartile and lower line the lower quartile. Whiskers represent 1.5 × IQR. Ctrl, control; NES, normalized enrichment score; NS, not significant.

