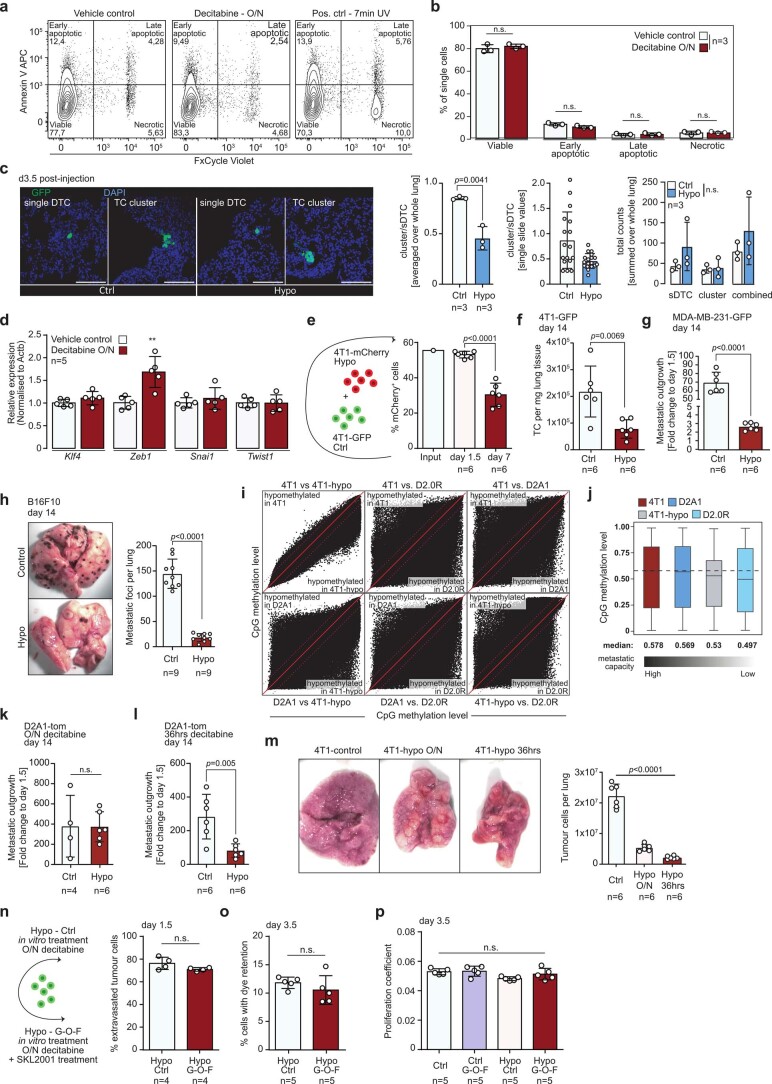
Extended Data Fig. 9. Hypomethylation does not affect cellular fitness or homing capacity but limits metastatic outgrowth.
a, Representative flow cytometry gates for assessing cell viability of vehicle control treated (left panel), hypomethylated (mid panel) and UV irradiated positive control cells (right panel). b, Corresponding quantification of viable, early apoptotic, late apoptotic and necrotic vehicle control or overnight decitabine treated 4T1 cells Data are presented as mean values +/− s.d., p values were calculated by two-tailed t-test shown. n.s., not significant. n = 3 independent experiments. c, Representative images and quantifications of sDTC (left panels) and tumor cell clusters (right panels) in mice 3.5 days postinjection for Ctrl (two left images), and hypomethylated TC (two right images). For all images stacks of 12 µm were acquired and z-projections using maximum intensity are displayed. All images were acquired using 40X magnification. Panels display overlays of DAPI (cell nuclei, blue) and GFP (TC, green). Quantification shows cell cluster to sDTC ratios (left panel), which were calculated for each lung by summing cell clusters and sDTC across all analysed sections. Quantification in the middle displays ratios for each analysed slide (sum of two sections). Quantification on the right displays absolute counts per biological replicate for sDTC, tumor cell clusters and the combination of both. In order to adhere to the 3R principles, this experiment used the same controls and the same representative control images as the experiment presented in Extended Data Fig. 5h (see methods for specifications). n = 3 mice. d, Relative expression of key EMT-inducing transcription factors Klf4, Zeb1, Snai1 and Twist1 in 4T1 cells treated over-night with decitabine or vehicle control. Target gene expression was normalized to Actb and relative expression to respective controls was calculated using the 2-ΔΔCt-method. Data are presented as mean values +/− s.d., p value by two-tailed t-test is shown. ** p value < 0.01. n = 5 independent experiments. e, Schematic of experiment. 4T1-GFP control cells were mixed with overnight decitabine treated 4T1-mCherry cells in 1:1 ratio and injected into the tail vein of mice (left panel). Quantification of mCherry+ TC within the total TC pool at the timepoint of injection, 1.5 days and 7 days postinjection (right panel). Data are presented as mean values +/− s.d., p value by two-tailed t-test is shown. n = 6 mice. f-h, Cells were treated over-night with decitabine and metastatic burden was assessed 14 days postinjection for, f, 4T1-GFP cells (Balb/c mice) measuring tumor cell abundance per mg lung tissue, g, human MDA-MB-231-GFP breast cancer cells (NSG mice) measuring metastatic outgrowth calculated as fold change to day 1.5 injected control mice, and, h, B16F10 melanoma cells (in B6 mice), counting metastatic foci per lung. Representative images display whole metastatic lungs of mice injected with B16F10 control cells (upper image) or B16F10-hypo cells (lower image). Data are presented as mean values +/− s.d., p values by two-tailed t-test are shown. To adhere to the 3R principles, the experiment in panel f used the same control as the experiment presented in Fig. 2e (see methods for specifications). n = 6–9 mice. i, Box plots showing methylation level of CpGs included in the methyl array in 4T1, D2A1, 4T1-hypo and D2.0R cells. Black gradient below indicates metastatic capacity of the individual cell line, with 4T1 cells being the most aggressive and D2.0R cells being the least aggressive cell line. Size of box represents interquartile range (IQR), with midline representing the median of the data, upper line the upper quartile and lower line the lower quartile. Whiskers represent 1.5 times IQR. j, Scatter plot of methylation level for individual CpGs included in the methyl array comparing each cell line with each other. Red line indicates no differences in methylation, dotted red lines indicate thresholds for >10% differences in methylation. k, Metastatic outgrowth calculated as fold change to day 1.5 injected control mice of control D2A1 cells and D2A1 cells that were treated with decitabine overnight, or, l, for 36 hrs. Data are presented as mean values +/− s.d., p values by two-tailed t-test are shown. n = 4–6 mice. m, Total tumor cell abundance in mice 14 days postinjection with 4T1 control cells or 4T1 cells that were treated overnight or for 36hrs with decitabine. Representative images show whole metastatic lungs of mice injected with control cells (left panel), overnight treated cells (mid panel) and cells treated for 36hrs (right panel). Data are presented as mean values +/− s.d., p values by one-way ANOVA with Tukey post-test are shown. n = 6 mice. n, Schematic of experiment. 4T1-GFP cells were treated overnight with either decitabine (Hypo Ctrl) or decitabine and SKL2001 (Hypo G-O-F) and injected into the tail veins of mice. Quantification shows the percentage of extravasated TC 1.5 days postinjection and, o, the percentage of TC with dye retention 3.5 days postinjection. Data are presented as mean values +/− s.d., p values were calculated by two-tailed t-test. n.s., not significant. n = 5 mice. p, Proliferation coefficients were calculated as the ratio of CellTrace mean fluorescence intensity (MFI) at day 3.5 and average CellTrace MFI at day 1.5 from matched experiments for 4T1-GFP control cells (Ctrl), SKL2001 reprogrammed cells (Ctrl G-O-F), over-night decitabine treated cells (Hypo Ctrl) and over-night decitabine and SKL2001 treated cells (Hypo G-O-F). Low proliferation coefficients reflect high proliferation rate. Cells with dye retention were excluded from the analysis. Data are presented as mean values +/− s.d., p values were calculated by one-way ANOVA with Tukey post-test. n.s., not significant. n = 5 mice.

