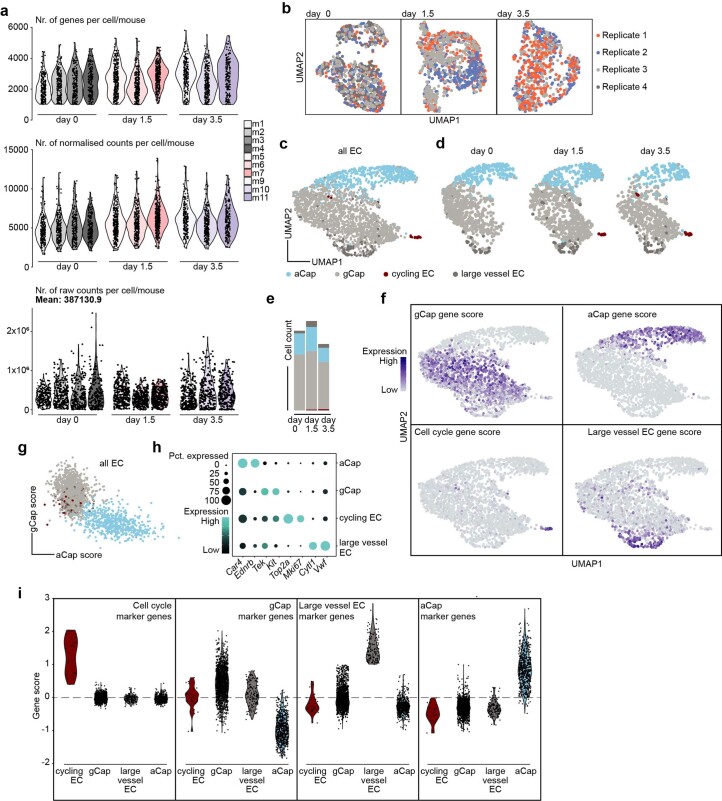
Extended Data Fig. 3. Classifying lung EC reveals emergence of cycling and activated gCap.
a, Number of detected genes (upper panel), normalized gene counts (mid panel) or total gene counts (lower panel) for each cell passing quality filtering split by timepoint and biological replicate. Only EC with detected genes >1000 were analysed. n = 3-4 mice. b, UMAP of lung EC isolated at day 0 (left panel, 839 cells), day 1.5 (mid panel, 941 cells) and day 3.5 (right panel, 699 cells) coloured by biological replicate. n = 3-4 mice. c, UMAP of classified EC coloured by cell type (2,479 cells) and d, split by timepoint. e, EC cell type distribution split by timepoint. f, Visualization of marker gene scores used for classification of lung EC on the UMAP. g, Scatter plot of gCap vs. aCap gene scores in individual lung EC. Cells are coloured by classified cell type. h, Dot plot of selected EC subtype marker genes. Dot size reflects percentage of total EC that express the marker gene and color reflects expression level. i, Violin plots of marker gene scores used for cell classification split by classified EC subtype.

