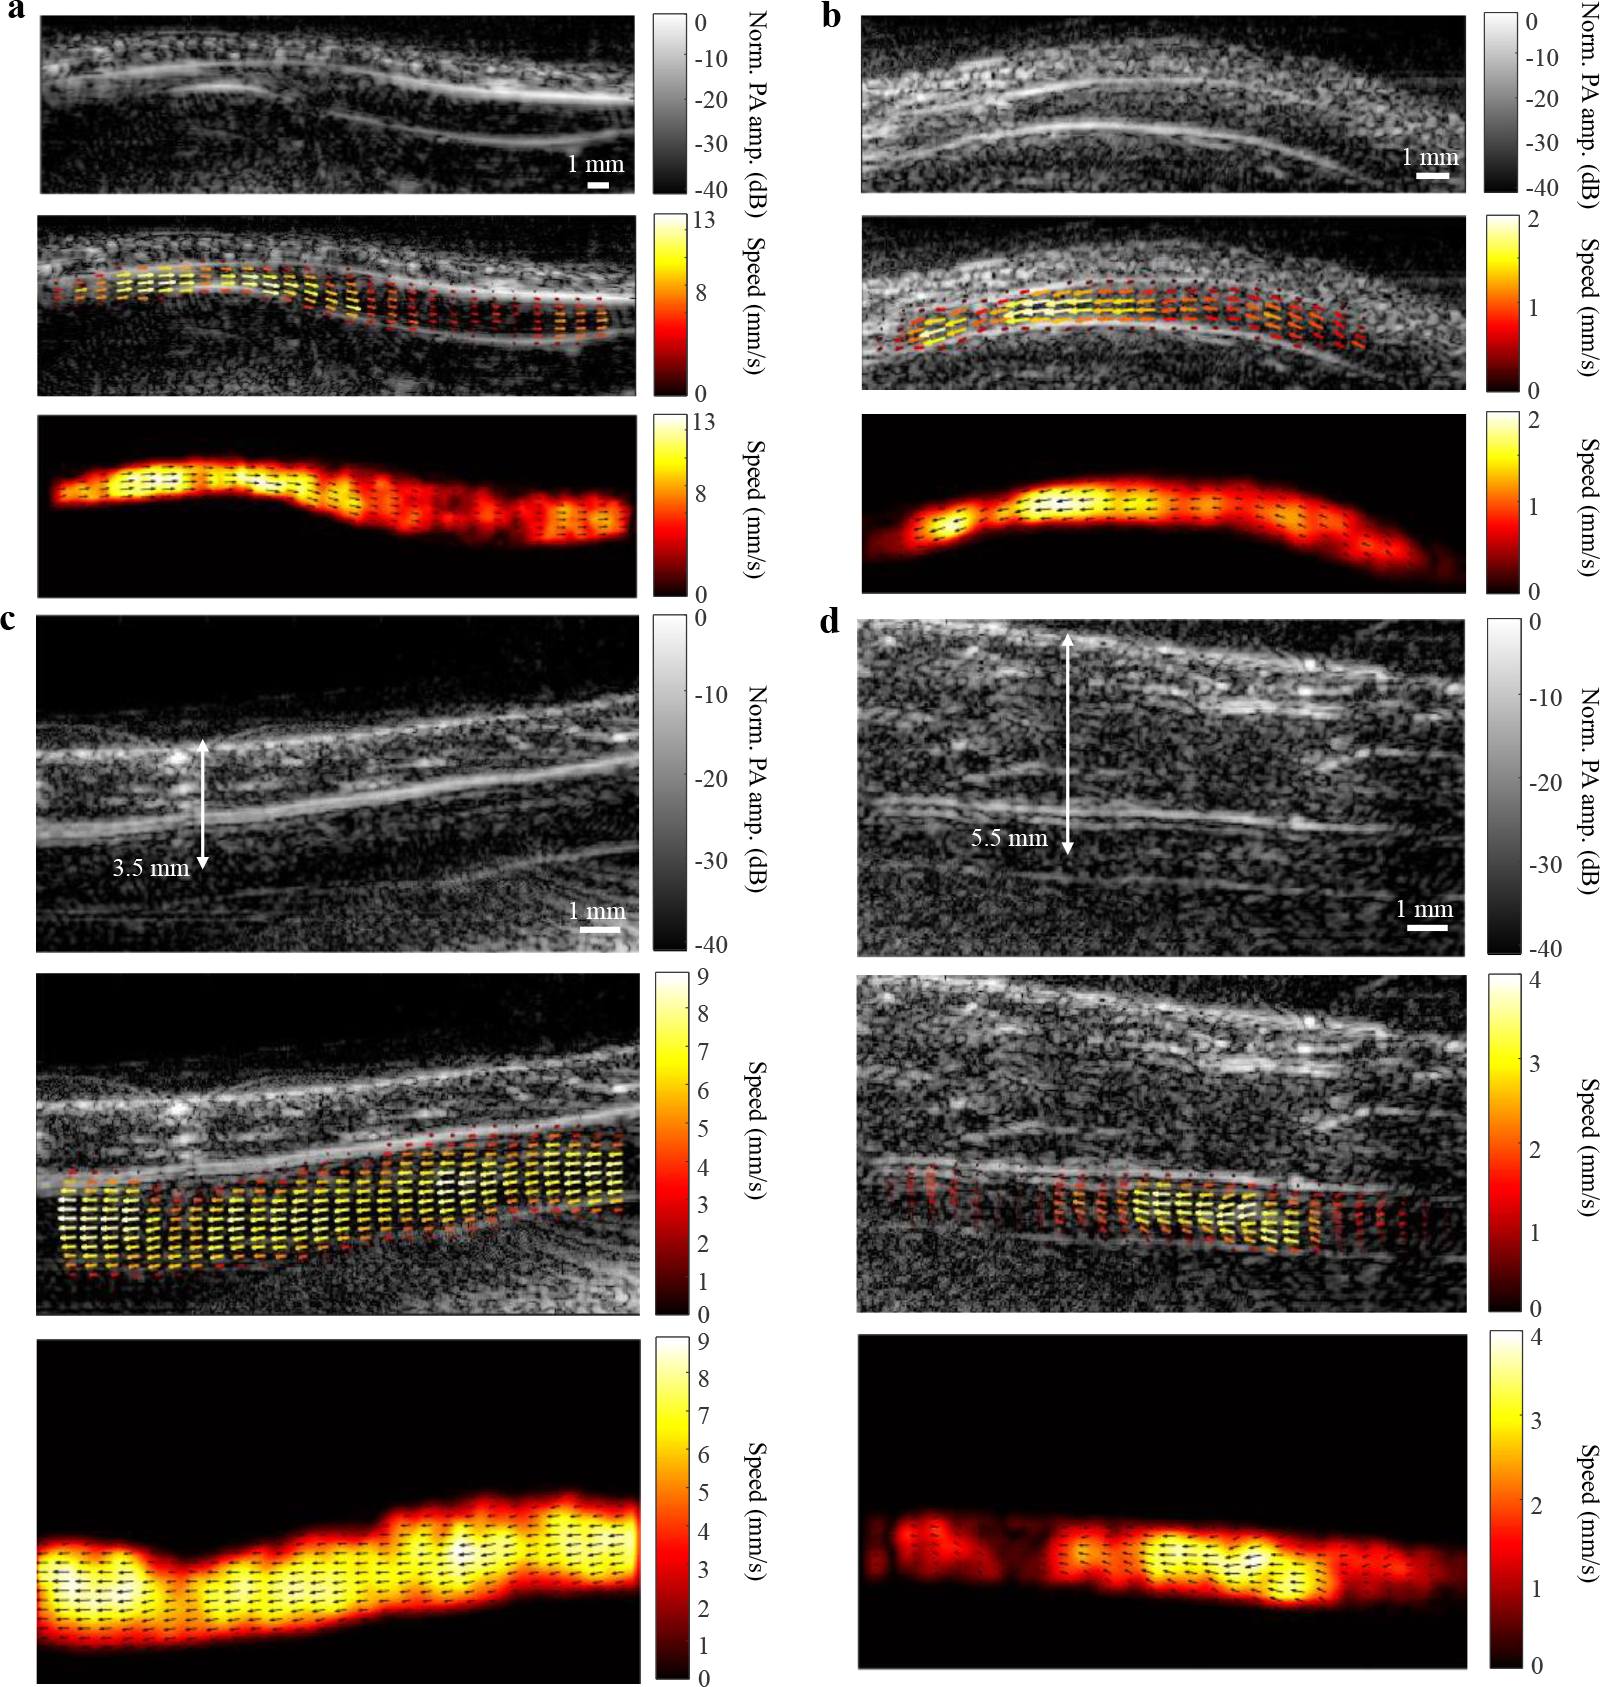
Fig. 3 |. PAVT vector flow maps.

a, Structural image (top), overlayed vector flow map (middle), and vector flow map (bottom) of a vessel in the wrist with a varying diameter. b, Structural and vector maps of a vessel in the palmar region imaged at an isosbestic wavelength for oxygenated and deoxygenated hemoglobin (805 nm). c–d, Structural and vector maps of vessels in the forearm imaged at 3.5 and 5.5 mm depths, respectively.
