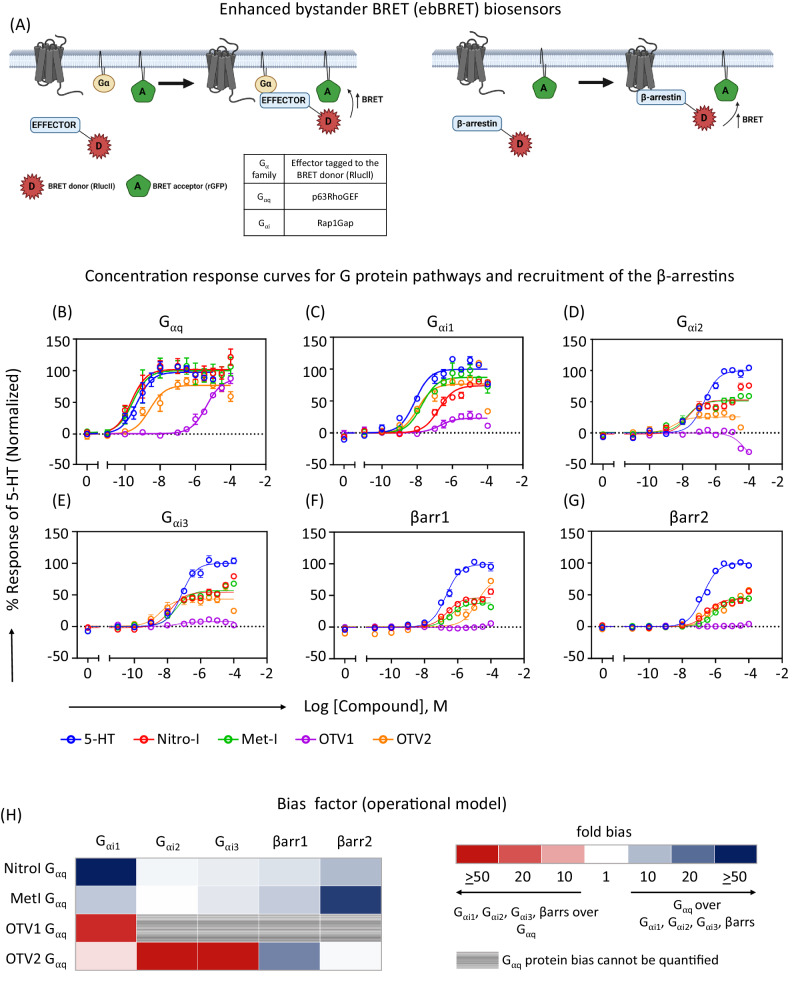
Fig. 2. G protein coupling and β-arrestin recruitment for Nitro-I, Met-I, OTV1 and OTV2 in living cells.
A Schematic representation of enhanced bystander BRET (ebBRET) biosensors used to measure G protein activation and β-arrestin (βarr) recruitment in HEK-293 cells, created with BioRender. B–G Dose response curves depicting the activity of Nitro-I, Met-I, OTV1 and OTV2 at the different G protein signaling pathways and for the recruitment of βarr 1 and 2. The ligand-promoted BRET (ΔBRET) was further normalized with respect to the response of 5-HT (mean ± SEM; n = 3). H Bias factor for the Gαq, Gαi family and βarr1 and 2. The operational model was used for bias calculations (see method section in supplementary information).

