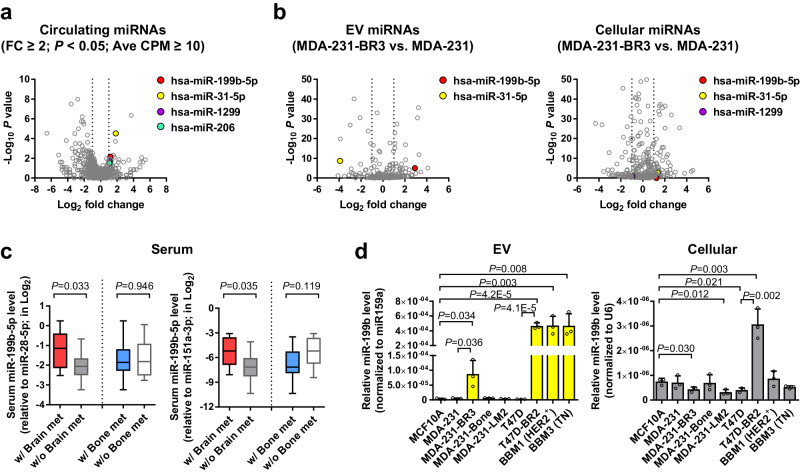
Fig. 1. miR-199b is associated with breast cancer brain metastasis.
a, b Volcano plots showing differentially expressed miRNAs in the sera of stage IV BC patients (a; case group with brain metastases vs. control group without; n = 21 for each group) and in the EV and cellular RNA of MBC cells (b; MDA-231-BR3 cells vs. parental cells). Data was from small RNA-seq. The positions of selected miRNAs were noted in each plot. c Relative levels of miR-199b in sera were determined by RT-qPCR, normalized to miR-28-5p or miR-151a-3p (both showing low coefficient of variation among all serum samples), and compared between stage IV BC patients with or without brain metastases, or between patients with or without bone metastases. For data using miR-28-5p as an internal reference, n = 9 w/ Brain met and n = 12 w/o Brain met, whereas n = 13 w/ Bone met and n = 8 w/o Bone met. For data using miR-151a-3p as an internal reference, n = 9 w/ Brain met and n = 12 w/o Brain met, whereas n = 14 w/ Bone met and n = 7 w/o Bone met. d Relative levels of EV and cellular miR-199b were determined by RT-qPCR, normalized to ath-miR159a spike-in (for EV RNA) or U6 (for cellular RNA), and compared among indicated cell lines (n = 3 biological replicates). The boxes in the box-and-whiskers plots show the median (center line) and the quartile range (25–75%), and the whiskers extend from the quartile to the minimum and maximum values. In bar graphs, values are shown as mean ± SD. The edgeR package was used for the statistical test in a and b. Unpaired two-tailed t-test was used in c and d. P values are indicated. Source data are provided as a Source Data file.

