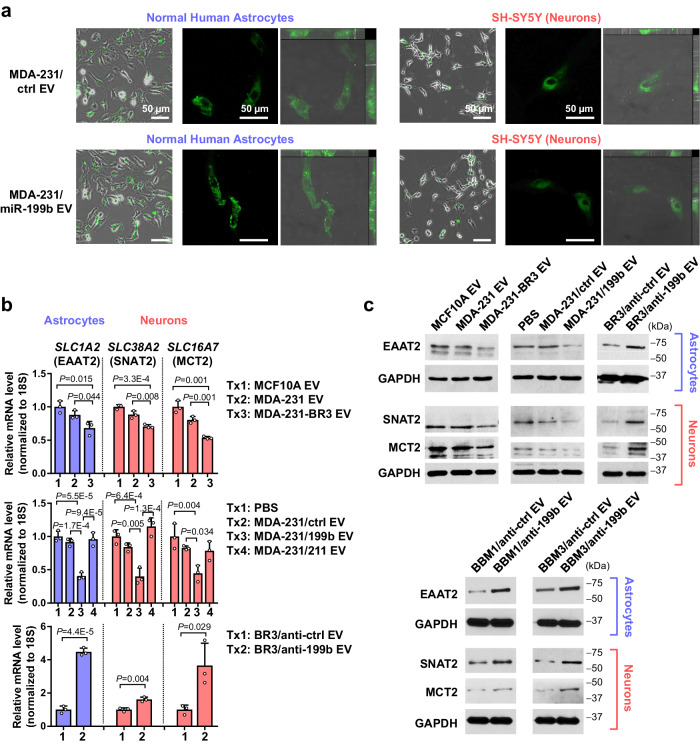
Fig. 3. EV miR-199b suppresses the expression of EAAT2, SNAT2, and MCT2 in astrocytes and neurons.
a Fluorescence (green) was detected in astrocytes (NHA) and neurons (differentiated SH-SY5Y) after an incubation with CFSE-labeled EVs for 24 h, which indicates EV uptake. A widefield image (CFSE and phase contrast), a confocal image (only showing CFSE), and orthogonal views of confocal microscopy z-stacks (CFSE and DIC) showing the 3D localization of CFSE signals are presented. b RT-qPCR-determined RNA levels of EAAT2 in astrocytes and levels of SNAT2 and MCT2 in neurons upon treatment with indicated EVs for 48 h. Data were normalized to 18S rRNA (n = 3 biological replicates). Values are shown as mean ± SD. c Western blot showing levels of indicated proteins in astrocytes and neurons upon treatment with indicated EVs for 48 h. GAPDH was used as a sample processing control. The samples derive from the same experiment but in some cases different gels for EAAT2, SNAT2, or MCT2 and another for GAPDH were processed in parallel. Unpaired two-tailed t-test was used in the top and bottom panels of b. One-way ANOVA followed by Tukey’s multiple comparison test was used in the middle panel of b. P values are indicated. Source data are provided as a Source Data file.

