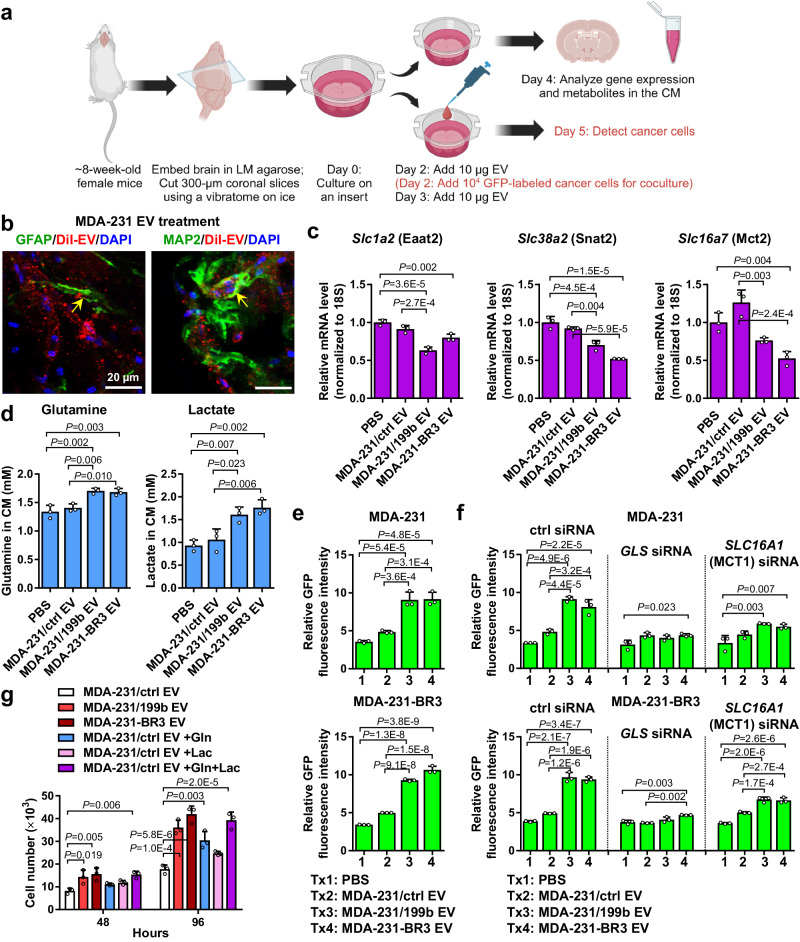
Fig. 5. EV miR-199b promotes BC cell growth on brain slices.
a Brain slice preparation and experiment procedure. Created with BioRender.com. b Brain slice uptake of EVs detected by IF of DiI-labeled EVs (red) in GFAP+ astrocytes and MAP2+ neurons (green). DAPI (blue) shows the nuclei. Experiment was repeated twice with similar results. c RT-qPCR-determined RNA levels of indicated genes in EV-treated brain slice (n = 3 biological replicates). d Levels of metabolites in the culture media determined by ELISA (n = 3 biological replicates). e GFP-labeled MDA-231 or MDA-231-BR3 cells were seeded onto the brain slices on day 2; total GFP fluorescence intensity on each brain slice was measured on day 5 to indicate the abundance of labeled cancer cells (n = 3 biological replicates). f GFP-labeled MDA-231 or MDA-231-BR3 cells transfected with indicated siRNA were seeded on day 2 and the fluorescence intensity on each brain slice was measured on day 5 (n = 3 biological replicates). g MDA-231 cells seeded in 12-well plates were cultured in CM collected from indicated EV-treated brain slice cultures. When indicated, glutamine and lactate were added to the CM to reach a final concentration of 1.71 mM and 1.61 mM, respectively. Cell numbers were counted after 48 and 96 h (n = 3 biological replicates). In bar graphs, values are shown as mean ± SD. One-way ANOVA followed by Tukey’s multiple comparison test was used in c–g. P values are indicated. Source data are provided as a Source Data file.

