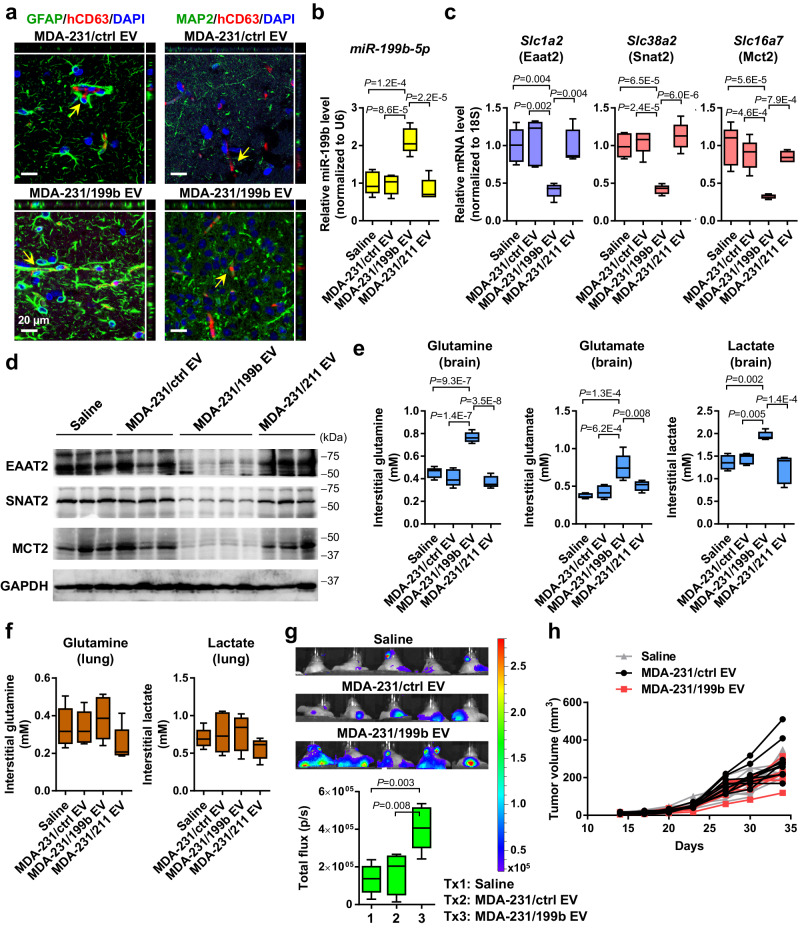
Fig. 6. EV miR-199b regulates metabolite transporters in the brain and promotes breast-to-brain metastasis.
a EVs from indicated cells were i.v. injected into NSG mice. After 24 h, the brain was collected and sectioned for IF analysis to detect human-specific CD63 (red) in GFAP+ astrocytes and MAP2+ neurons (green). DAPI (blue) shows the nuclei. Orthogonal views of confocal microscopy z-stacks are shown. Experiment was repeated twice with similar results. b, c NSG mice received i.v. injections of indicated EVs twice a week for 5 weeks. After the last EV treatment, the brain was collected and RNA levels of miR-199b and indicated genes were determined by RT-qPCR. Data were normalized to U6 (for miR-199b) or 18 S rRNA (for mRNAs) (n = 5 mice per group). d Western blot showing levels of indicated proteins in brain tissues from EV-treated mice. GAPDH was used as a loading control. Experiment was repeated twice with similar results. e, f After EV treatment, brain (e) and lung (f) tissues were dissociated, and the cell-free (interstitial) fraction was separated and measured for extracellular levels of glutamate, glutamine, and lactate (n = 5 mice per group, except for the Saline group in e Lactate measurement with n = 4 mice). Glutamate levels in lung tissues were below the limit of detection. g After 5 weeks of EV treatment, mice received mammary fat pad injection of luciferase-labeled MDA-MB-231-HM cells. Bioluminescent imaging and quantification results at week 5 after cancer cell injection were shown (n = 5 mice per group). h Measurements of the primary mammary tumor volume at the indicated time points (n = 10 mice per group). The boxes in the box-and-whiskers plots show the median (center line) and the quartile range (25–75%), and the whiskers extend from the quartile to the minimum and maximum values. One-way ANOVA followed by Tukey’s multiple comparison test was used in b, c, e, f, and g. Two-way ANOVA was used in h (repeated measures). P values are indicated. No statistical significance was found in f and h. Source data are provided as a Source Data file.

