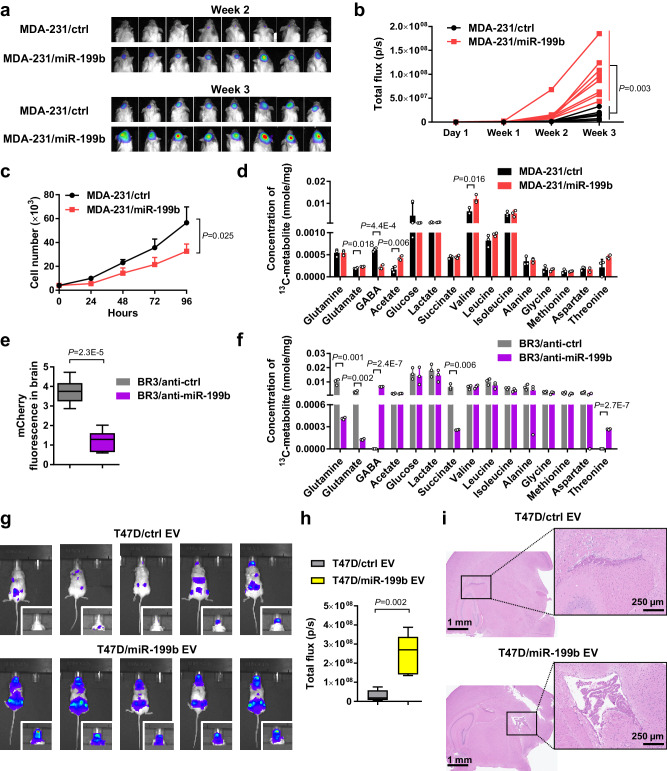
Fig. 7. miR-199b enhances the growth of BC tumors in the brain and alters glutamine metabolism.
a, b Luciferase-labeled MDA-MB-231/miR-199b or control cells were intracranially injected into NSG mice (n = 8 mice per group). Bioluminescent images at week 2 and week 3 (a) were quantified (b). c In vitro cell proliferation assessments by counting cell numbers every 24 h (n = 3 biological replicates). Medium was replenished every other day. d After the bioluminescent imaging at week 3, mice in a received infusion of 13C-labeled glutamine. The whole brain was dissociated and the cell-free interstitial fraction was analyzed by 2D NMR to quantify 13C-labeled metabolites. Data were normalized to the dry weight of interstitial fraction (n = 3 mice per group). e mCherry-labeled MDA-231-BR3/anti-miR-199b or control cells were intracranially injected into NSG mice. At week 3, the whole brain was dissociated and the cell-containing fraction was used for measurement of mCherry fluorescence (n = 6 mice per group). f In mice received intracranial injections of MDA-231-BR3/anti-miR-199b or control cells, 13C-labeled glutamine was administered by infusion at week 3 and the whole brain was collected and dissociated. The cell-free interstitial fraction was analyzed by 2D NMR to quantify 13C-labeled metabolites. Data were normalized to the dry weight of interstitial fraction (n = 3 mice per group). g, h EVs from T47D/ctrl and T47D/miR-199b cells were i.v. injected into NSG mice twice a week for 5 weeks. After the last EV treatment, mice received an intracardiac injection of luciferase-labeled T47D-BR2 cells. In vivo whole body bioluminescent imaging (g) and quantification of signals in the head (h) at week 5 after cancer cell injection were shown (n = 5 mice per group). i Representative brain H&E histological images showing brain metastases in mice from g. The boxes in the box-and-whiskers plots show the median (center line) and the quartile range (25–75%), and the whiskers extend from the quartile to the minimum and maximum values. In bar graphs, values are shown as mean ± SD. Two-way ANOVA was used in b and c (repeated measures). Unpaired two-tailed t-test was used in d, e, f, and h. P values are indicated. Source data are provided as a Source Data file.

