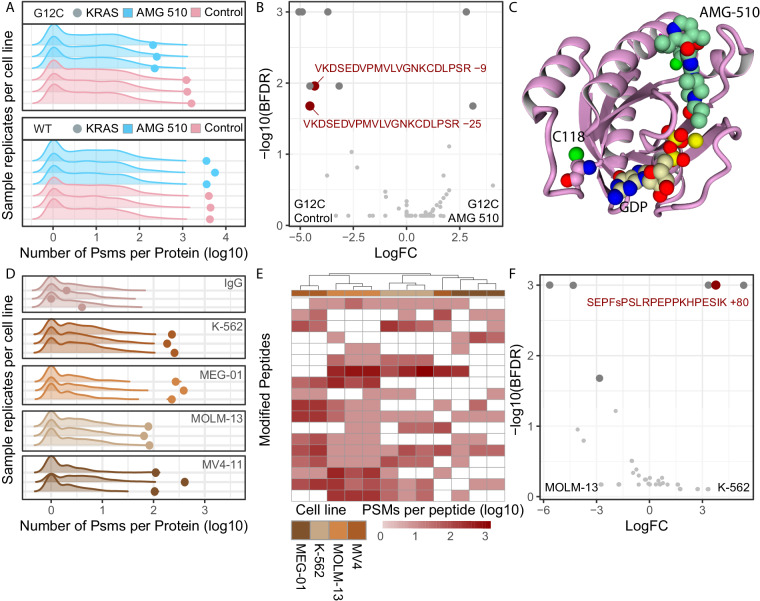
Fig. 3.
iPTMs detection of perturbation-induced and endogenous peptidoforms. (A) Pre-normalisation PSM counts for prey (density plots) and bait (dots) proteins for AMG-510 treated (blue) and untreated (salmon) samples for KRASWT and KRASG12C mutant cell lines, for each replicate IP-MS experiment. (B) Differential bait peptidoforms detected between AMG-510 and untreated KRASG12C samples according to the SAINTexpress, defined as BFDR <0.05. Only bait peptidoforms were included in the SAINTexpress analysis. (C) Structural model of C118 position relative to AMG-510 and GDP binding site in KRASG12C protein. (D) Pre-normalisation PSM counts for prey (density plots) and bait (dots) proteins for IgG control (top) and endogenously enriched BRD4 across cell lines, for each replicate IP-MS experiment. (E) Clustering of post-normalised PSM counts for highly abundant peptidoforms belonging to bait BRD4 protein, excluding the IgG control samples. Unsupervised clustering performed with default hclust parameters with peptidoforms not detected in specific samples assigned a zero value following log transformation. (F) Differential bait BRD4 peptidoforms detected between K-562 and MOM-13 samples according to the SAINTexpress, defined as BFDR <0.05. Only bait peptidoforms were included in the SAINTexpress analysis.

