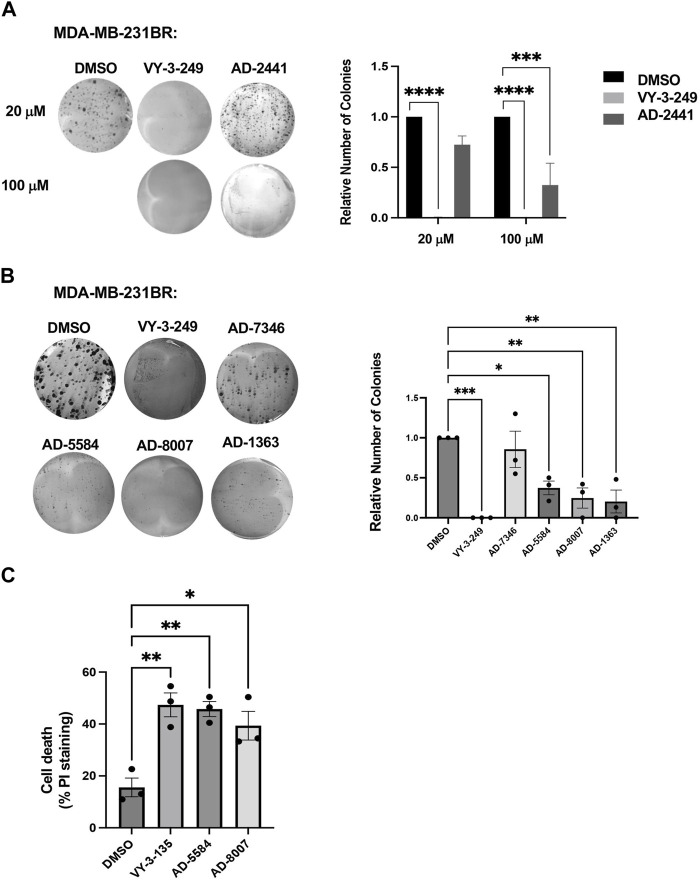
FIGURE 5.
In Vitro effect of ACSS2 inhibitors on MDA-MB-231BR cells cell survival. (A) Representative images of MDA-MB-231BR cells treated with ACSS2 inhibitors for 48 h at 100 μM and seeded in clonogenic cells survival assay stained with crystal violet. Average colony formation quantified and presented as average from three independent experiments. Two-way ANOVA reported as mean ± SEM. ***p < 0.001, ****p < 0.0001. (B) Representative images of MDA-MB-231BR cells treated with ACSS2 inhibitors for 48 h and seeded clonogenic cells survival assay stained with crystal violet. Average colony formation quantified and presented as average from three independent experiments. One-way ANOVA reported as mean ± SEM. *p < 0.05, **p < 0.01, ***p < 0.001. (C) Quantification of cell death as measured by Propidum Idodine (PI)+ cells detected by flow cytometry analysis of MDA-MB-231BR cells treated with ACSS2 inhibitors at 100 μM for 48 h. One-way ANOVA reported as mean ± SEM. *p < 0.05, **p < 0.01, ***p < 0.001.

