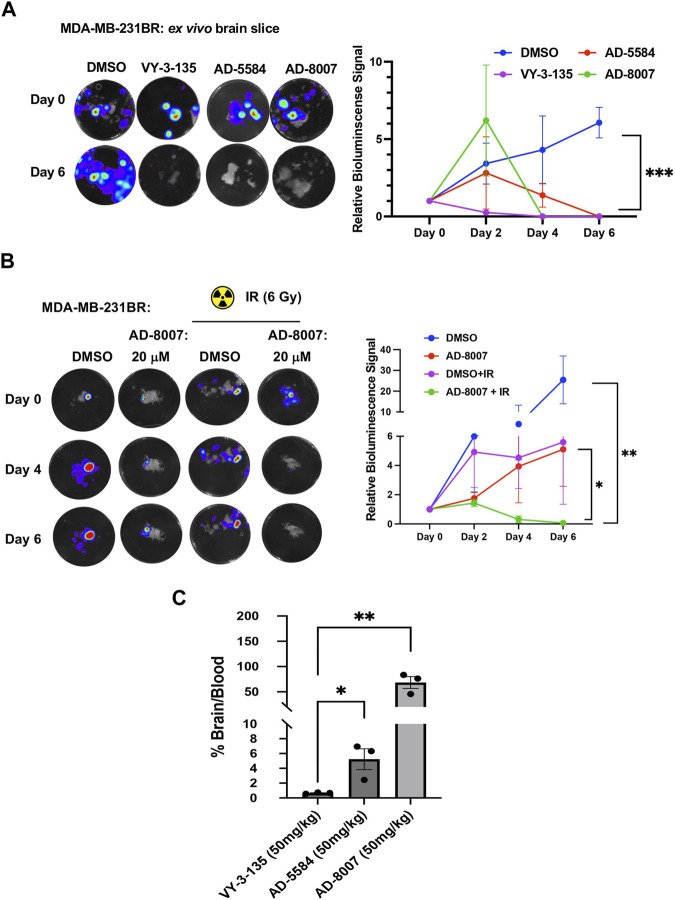
FIGURE 7.
Ex vivo and BBB permeability of ACSS2 inhibitors. (A) Representative images of ex vivo tumor-bearing brain slices were obtained from Nu/Nu mice injected with luciferase-tagged MDA-MB-231BR cells treated with ACSS2 inhibitors at 100 μM for 6 days. Quantified graph of relative bioluminescence signal at indicated day (n = 3) Two-way ANOVA reported as mean ± SEM. *p-value ***p < 0.001 (B) Representative images of ex vivo tumor bearing brain slices derived from nu/nu mice injected with luciferase tagged MDA-MB-231BR cells exposed to no irradiation (control) or one dose of 6Gy treated with ACSS2 inhibitors at 20 μM for 6 days (n = 3). ANOVA reported as mean.*p < 0.05. (C) Quantification of LC-MS peaks of ACSS2 inhibitor present in the brain over blood following intraperitoneal delivery of 50 mg/kg of drug for 30 min (AD-5584) or 1 h (AD-8007, VY-3–135) (n = 3). Blood extraction via intracardiac injection, perfusion, and brain retrieval. Student’s paired t-test reported as mean ± SEM; *p < 0.05, **p < 0.01.

