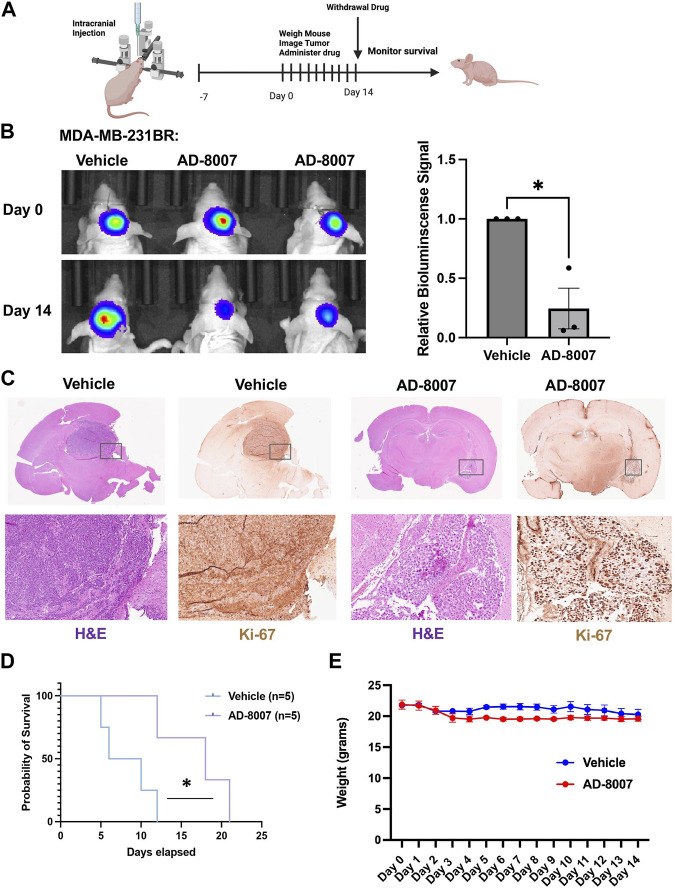
FIGURE 8.
Effects of AD-8007 on BCBM growth in vivo. (A) Schematic workflow for in vivo studies of AD-8007 treatment. (B) Representative images of bioluminescent detection of tumors from Nu/Nu mice injected with luciferase tagged MDA-MB-231BR cells at Day 0 (prior to drug treatment) and at 14 days post-drug treatment. Data are quantified and presented as average Relative Bioluminescence signal from mice injected with MDA-MB-231BR cells treated with Vehicle (n = 3) or AD-8007 treated mice (n = 3) (right). Student’s t-test reported as mean ± SEM; *p < 0.05. (C) Representative images of brain sections stained for H&E and Ki67 at 14 days-post treatment. Top: 4x magnification. Bottom: 10x magnification. (D) Kaplan Meyer survival analysis quantifying survival of mice injected with MDA-MB-231BR cells and treated with vehicle (n = 5) or AD-8007 (n = 5), *p < 0.05. (E) Quantification of weights (grams) of mice injected with MDA-MB-231BR cells and treated with vehicle (n = 3) or AD-8007 (n = 3) for 14 days, analyzed with two-way ANOVA, n. s.

