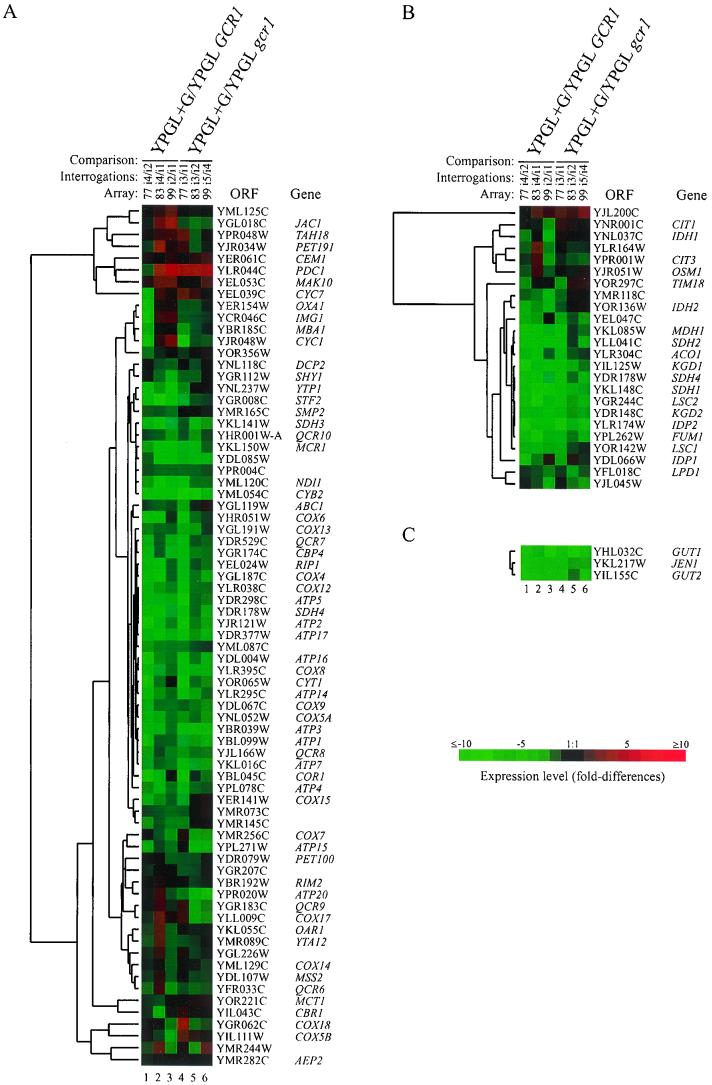
FIG. 2.
(A) Expression profile of respiratory genes in the wild type and gcr1 mutants. (B) Expression profile of genes encoding tricarboxylic acid pathway function in the wild type and gcr1 mutants. (C) Expression profile of genes encoding glycerol metabolic enzymes and lactate transporter. Total RNA was isolated for expression profiling 4 h after the addition of glucose to wild-type and gcr1 mutant cultures growing in YPGL. Genes were selected for inclusion in panels A and B based on the Martinsried Institute of Protein Sciences classification scheme. The lanes are as described in the legend to Fig. 1. Column headings for panel C are the same as those for panel B. The ratio of transcript levels is depicted visually according to the color scale on the figure. Red indicates increased expression relative to the reference, and green indicates decreased expression relative to the reference.

