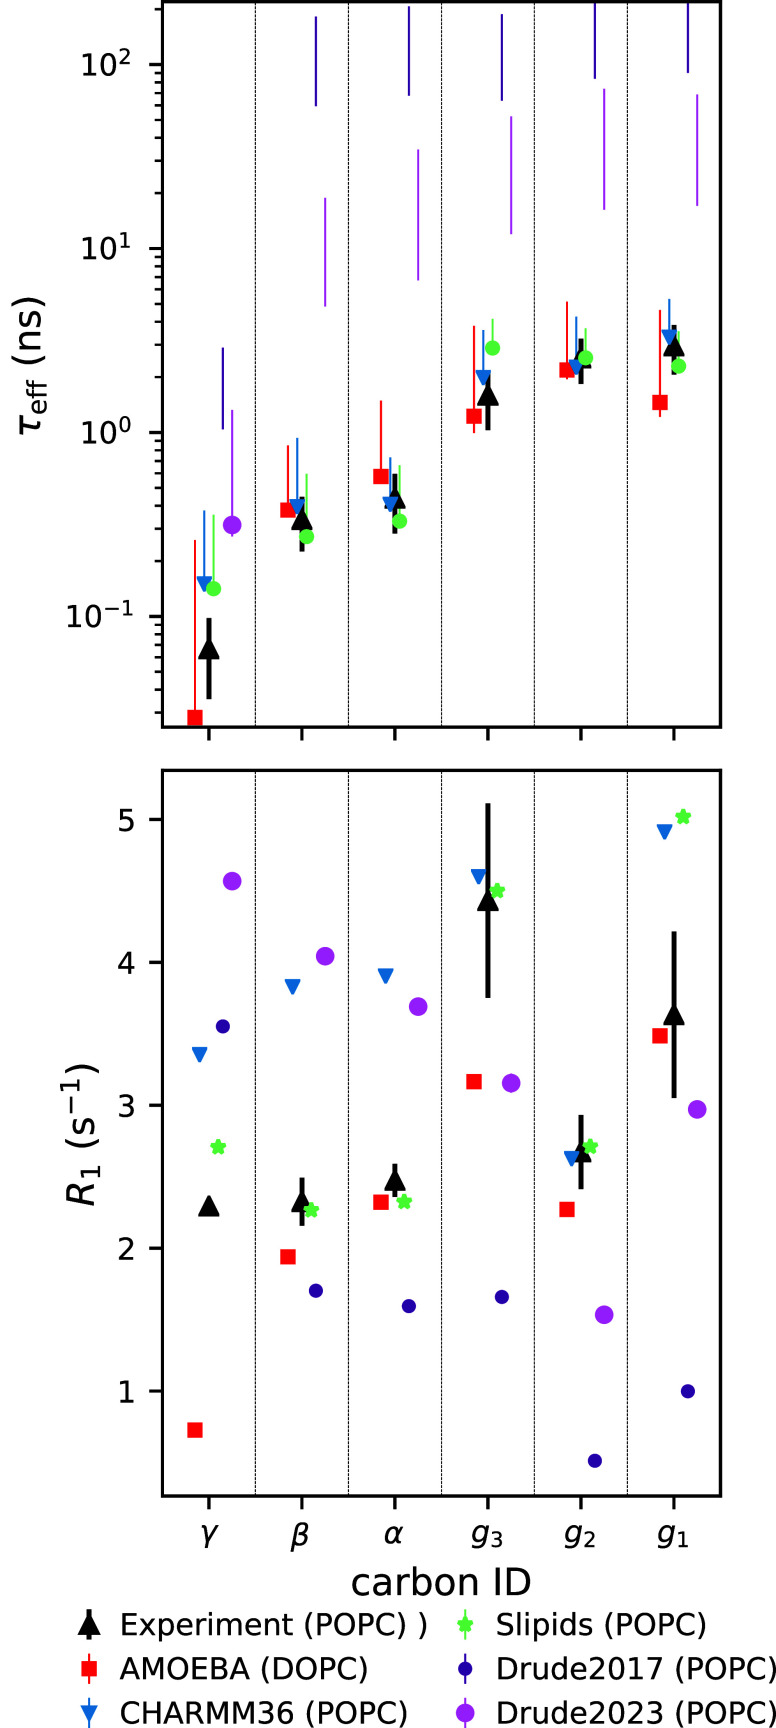
Figure 2.
Effective correlation times τeff (top) and spin–lattice relaxation rates R1 (bottom) for the polarizable, and the best-performing nonpolarizable (CHARMM36 and Slipids,119 data from ref (36)), force fields. Note that the top panel y-axis is logarithmic to visualize the slow dynamics of the Drude-based models. Experimental values are from ref (117). For the simulated τeff, the data point quantifies the average over the C–H bonds. If τeff could not be determined for all bonds due to slow convergence, then only the range from the mean of the lower to the mean of the upper error estimates is shown. For R1, the error bars were smaller than the symbol size. All of the simulations shown here were salt-free.

