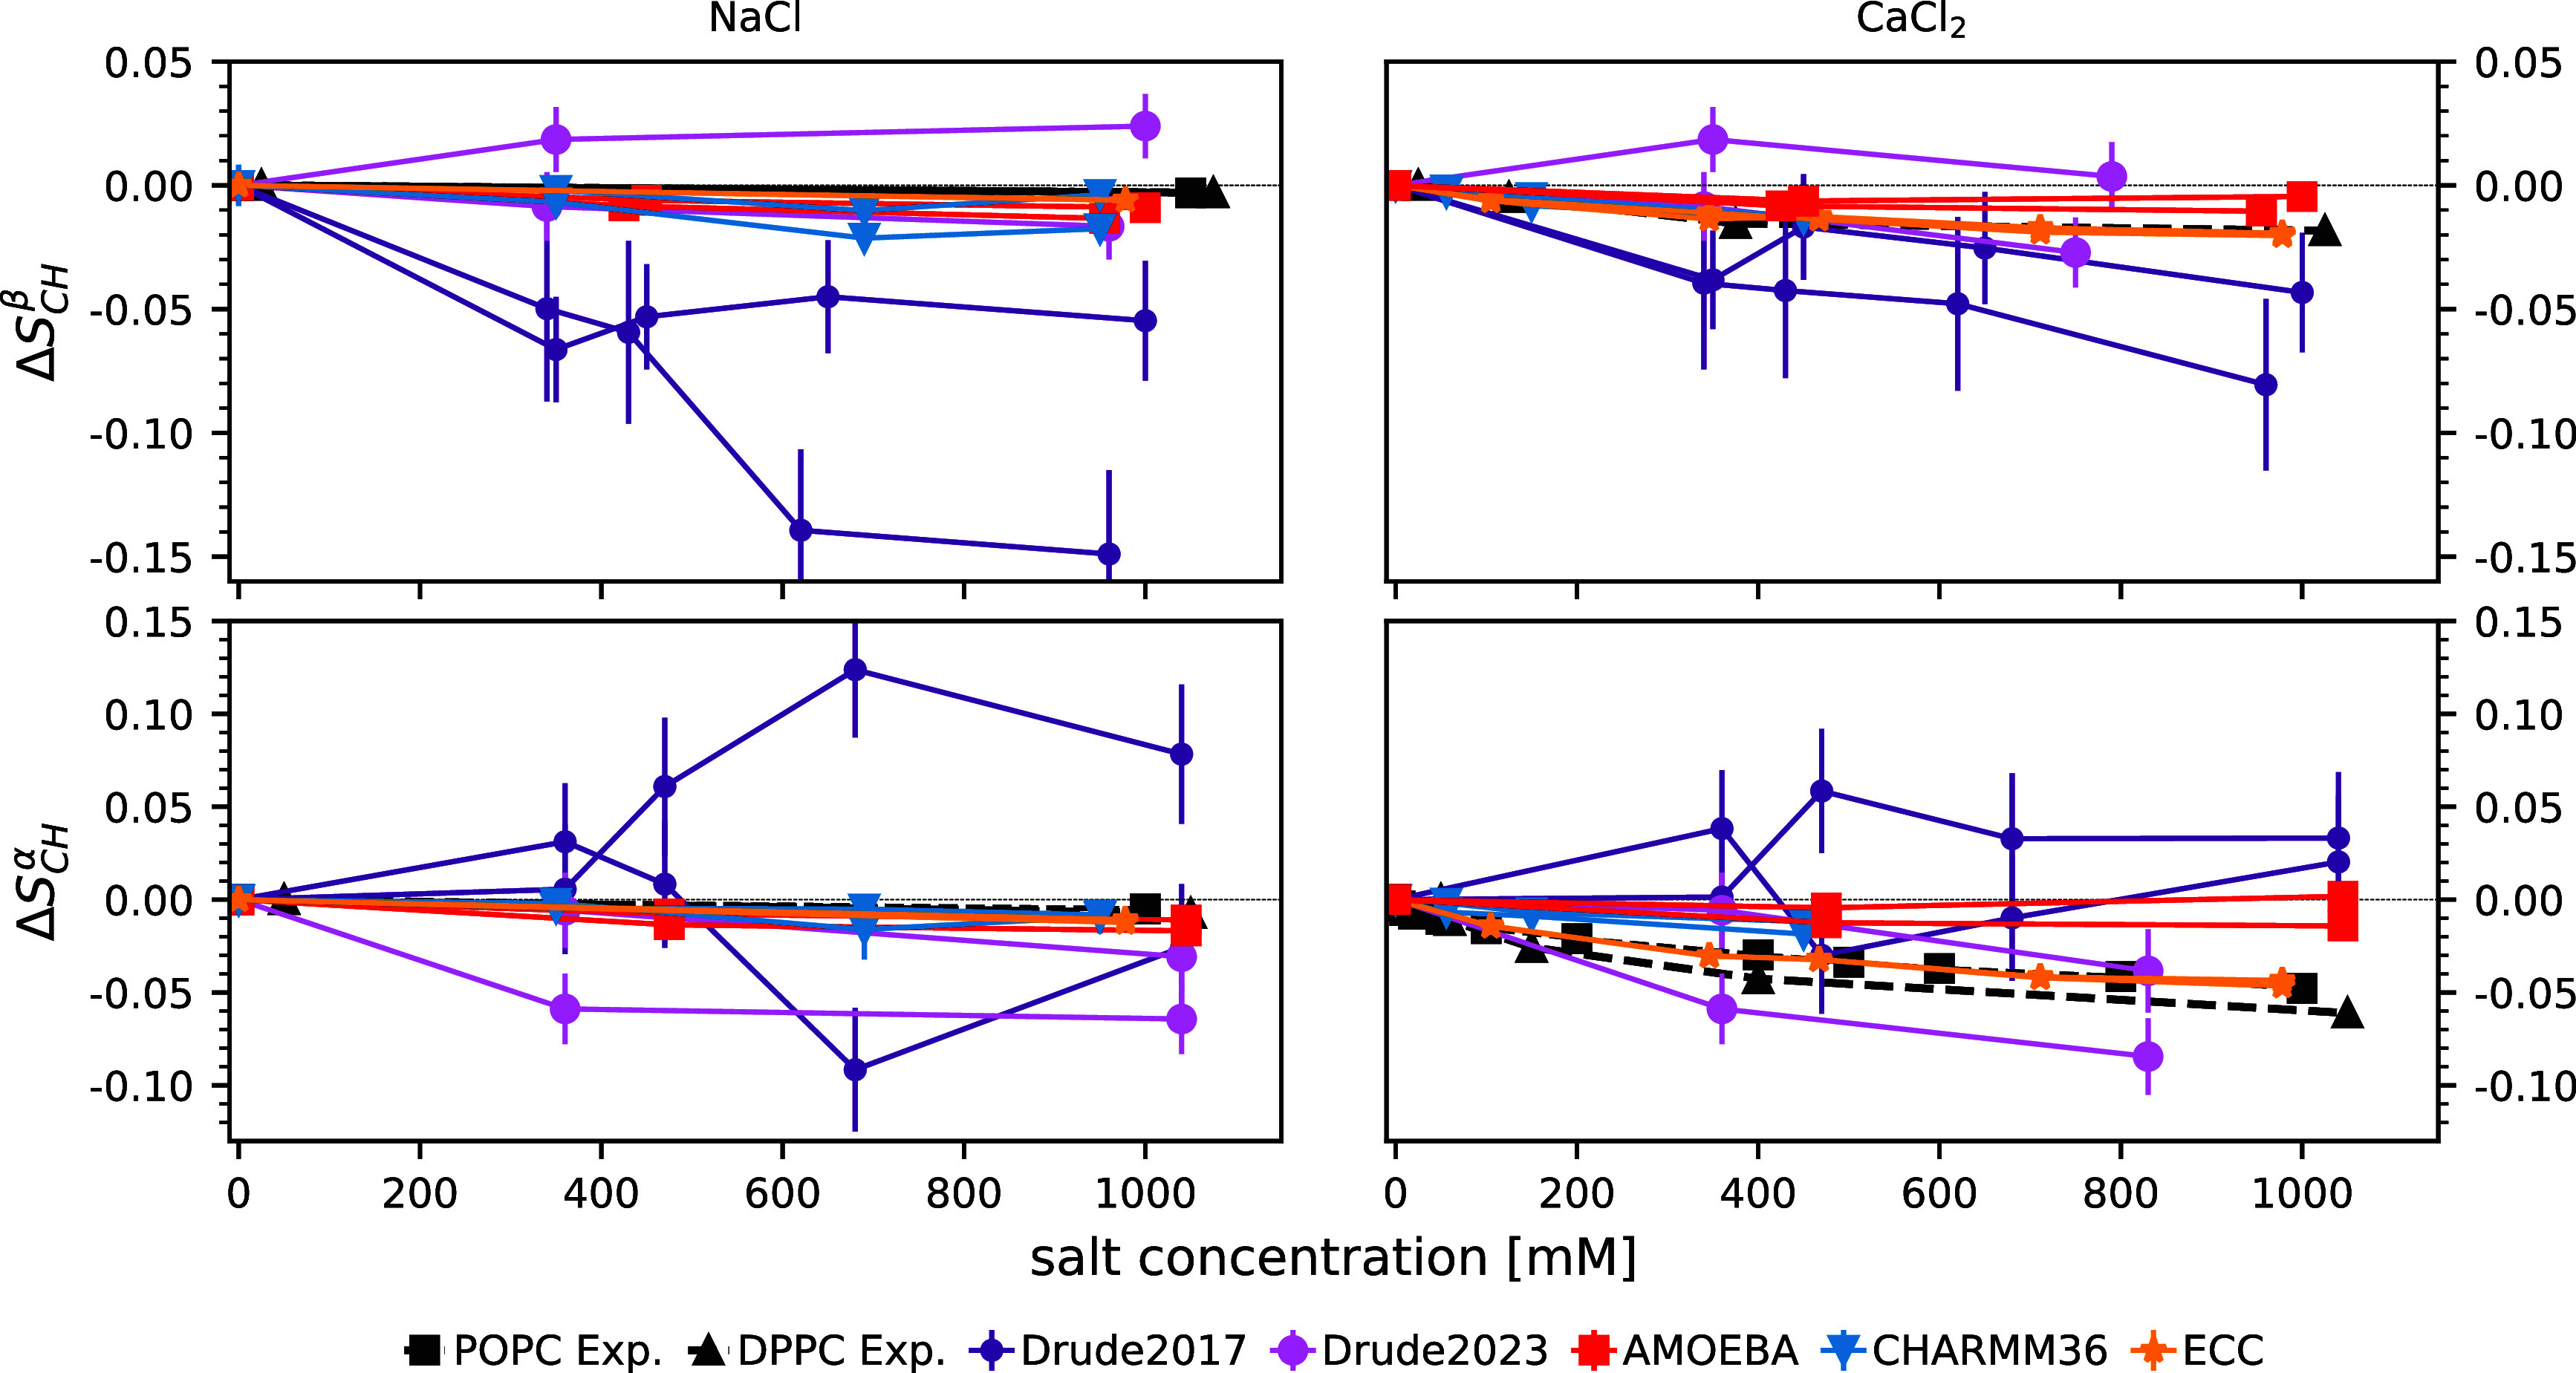
Figure 3.

Change in the lipid headgroup order parameters β (top row) and α (bottom row) upon increasing ion concentration with respect to the simulations without salt. Data were plotted separately for the two hydrogens attached to each carbon. CHARMM36 and ECClipids data are reproduced using the Zenodo repositories at refs (123−126) and ref (127), respectively. Experimental data are from refs (128),129. A zoomed-in version of this figure is given in SI Figure S4.
