
Figure 4.
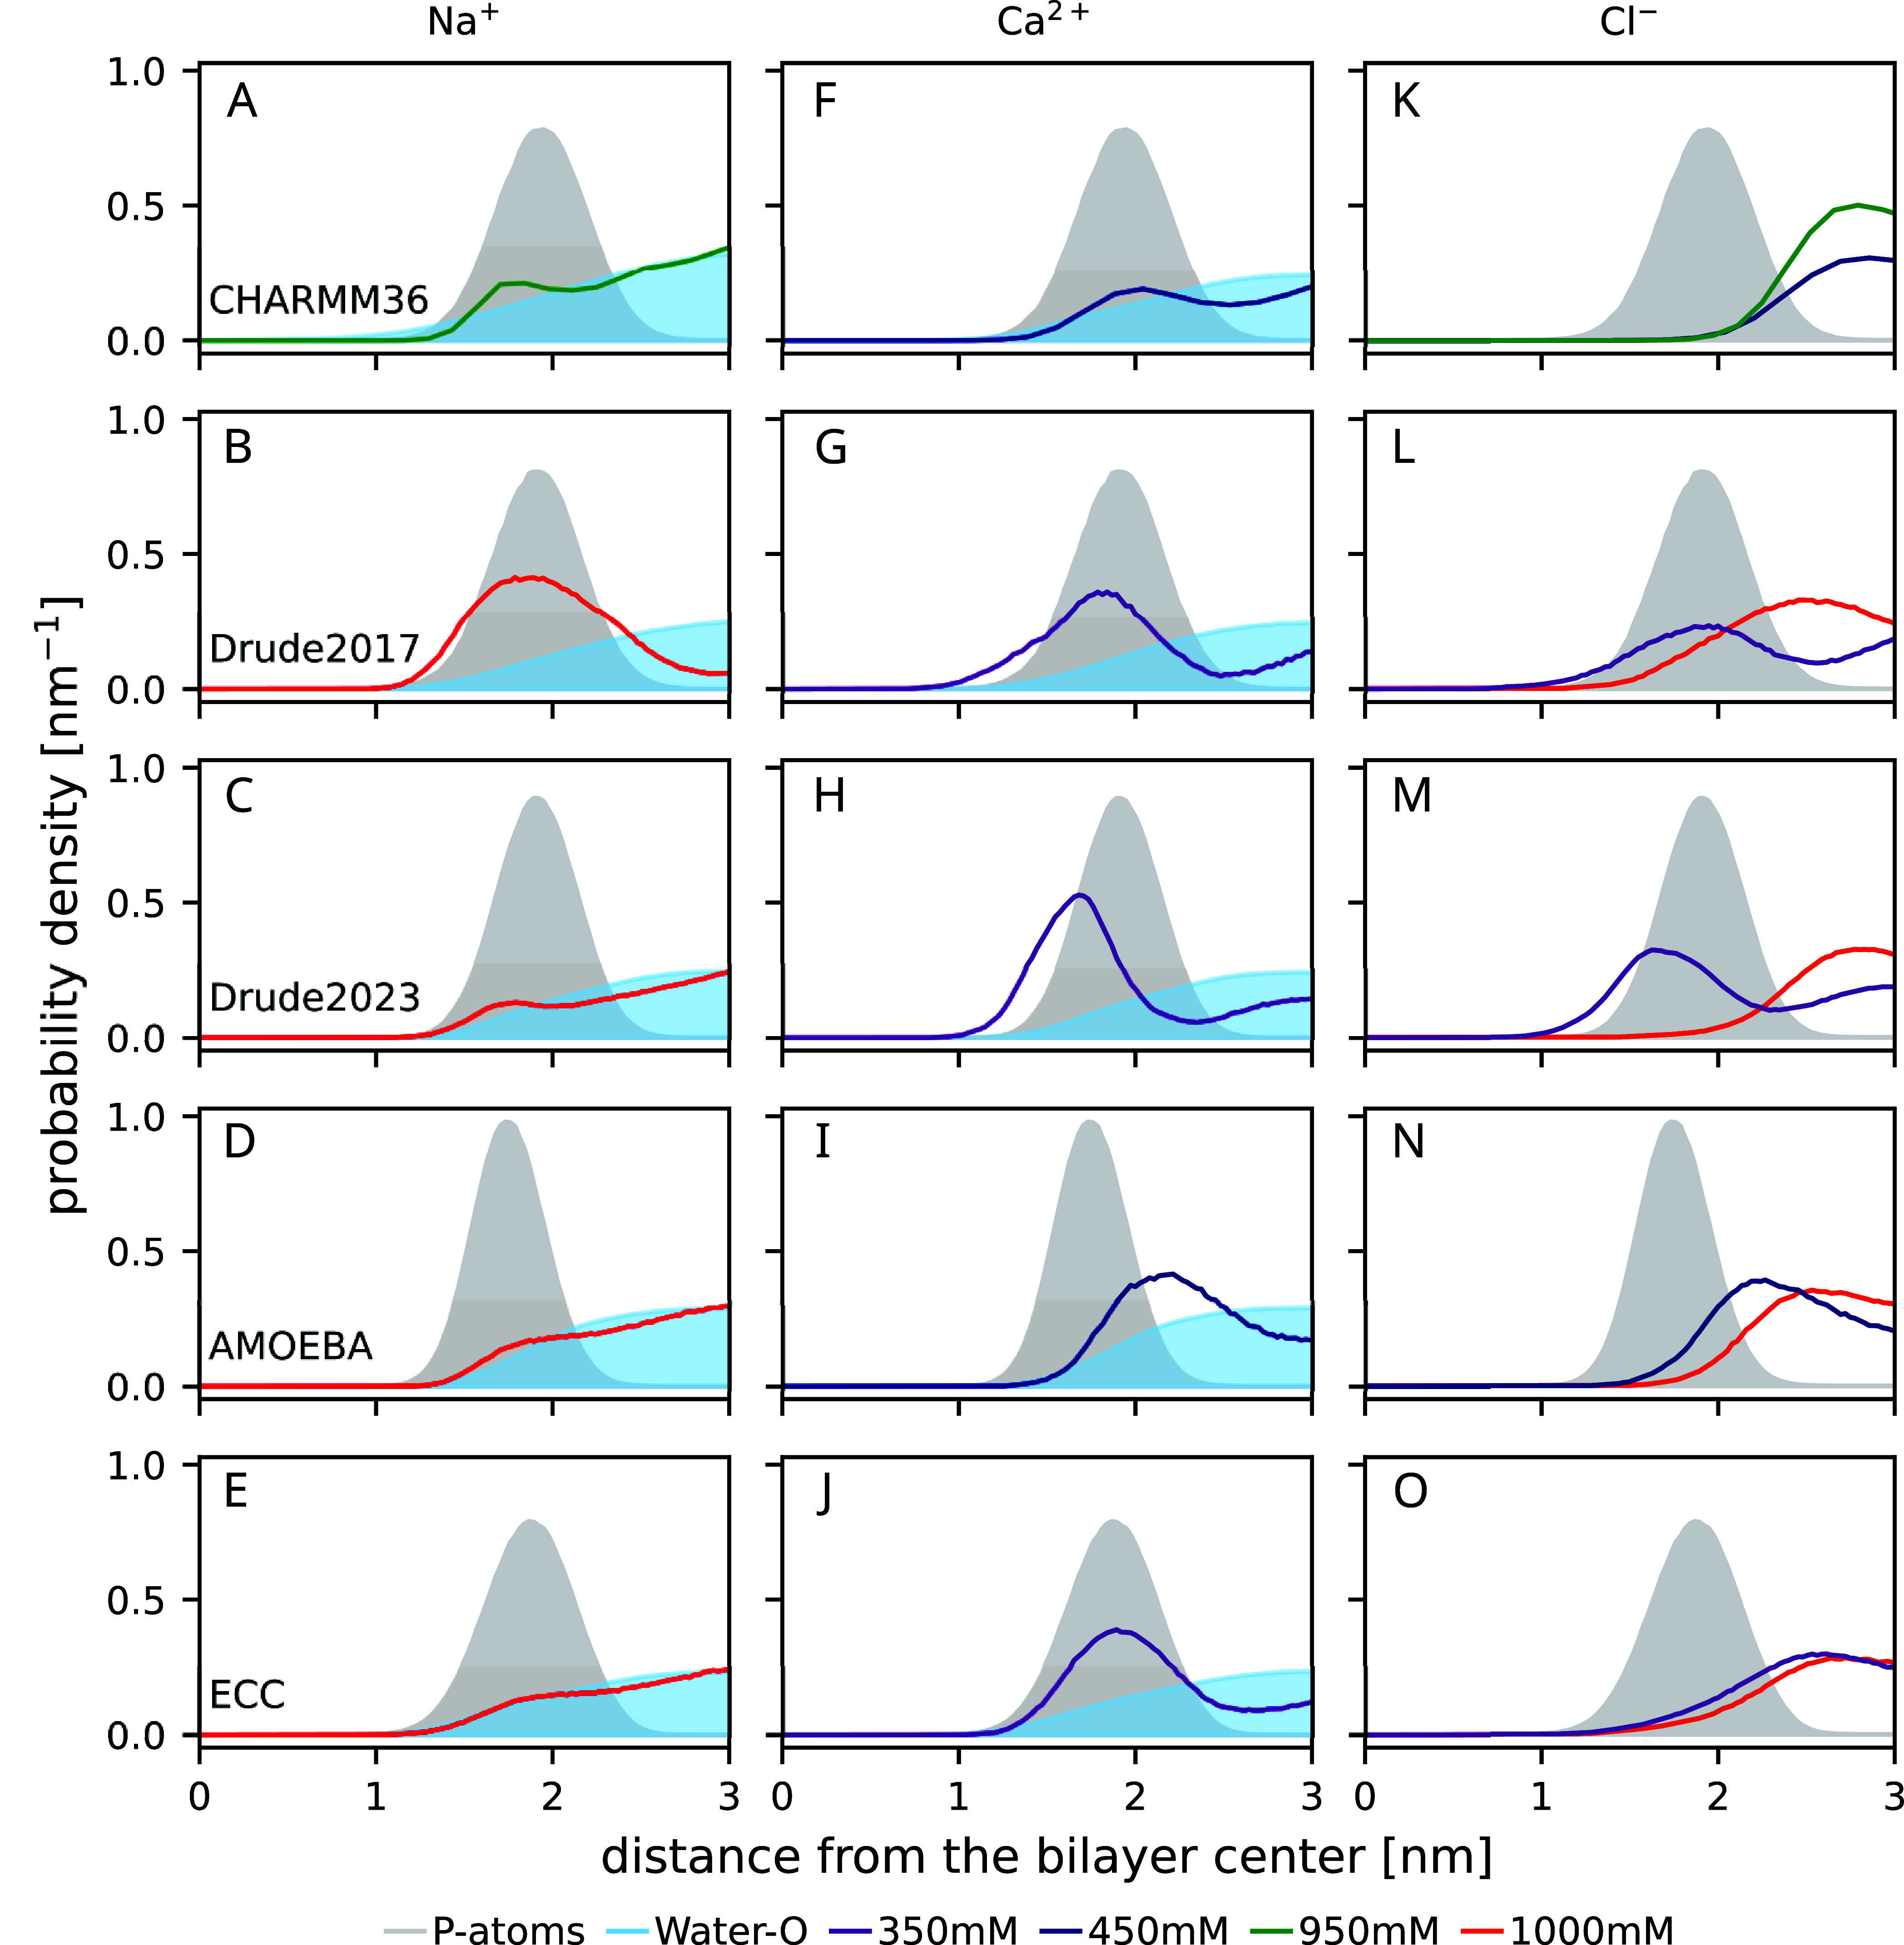
Density profiles along the membrane normal (from the top): CHARMM36, CHARMM-Drude2017, CHARMM-Drude2023, AMOEBA, and ECClipids. In the third column, the Cl– densities are shown in the same color as their cations in the first and second columns. Note that for CaCl2, 350 mM (Drude models and ECC) and 450 mM (AMOEBA and CHARMM36) concentrations are shown; while for NaCl, 1000 mM concentration is shown for all force fields except CHARMM36 (950 mM NaCl). The CHARMM36 data are reproduced using the Zenodo repositories of refs (123−126), ECC using the Zenodo repository of ref (127). Data are from POPC simulations for all force fields other than AMOEBA (DOPC).