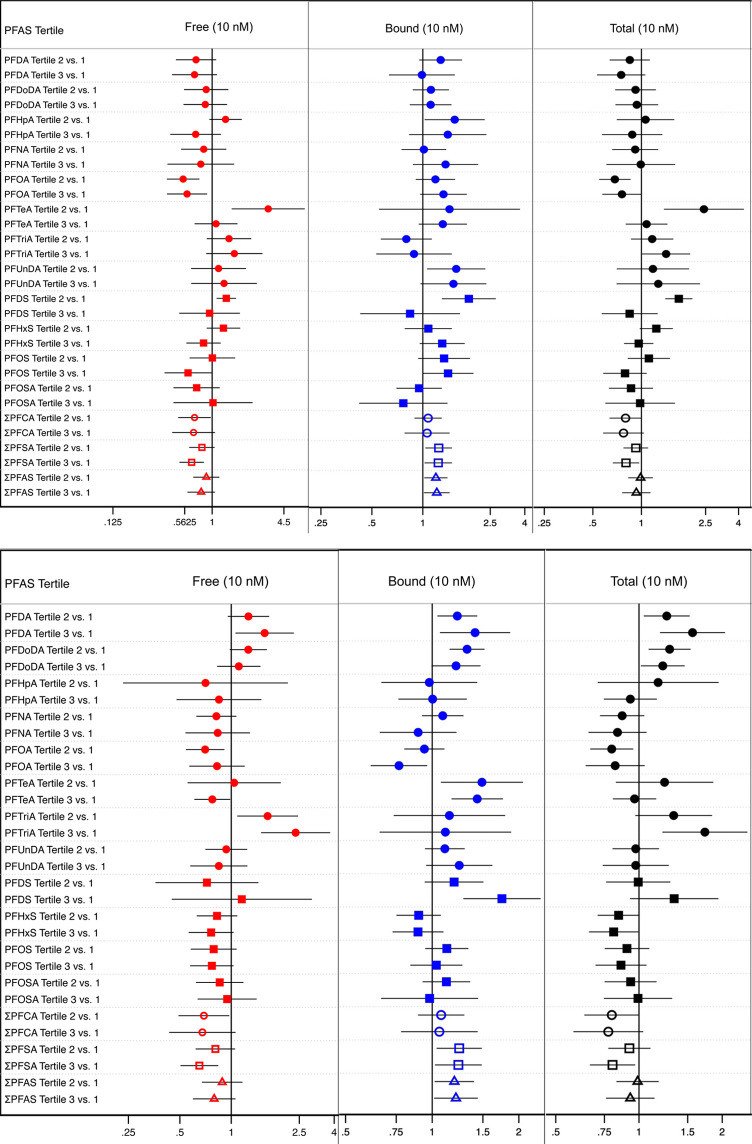
Figure 2.
Sex-stratified results for female-stratified (top) and male-stratified (bottom) adjusted parametric quantile regression models testing for percent differences in cortisol (10 nM) across PFAS tertiles. Models were adjusted for location, year, sex, and age at time of sample collection. Shapes indicate which class the modeled PFAS belongs to a filled circle = PFCA class, a filled square = PFSA class and an empty shape = the sum of a single class or both classes combined (i.e., empty circle = ΣPFCA, empty square = ΣPFSA, and empty triangle = Σall PFAS combined). Regression coefficients, 95% confidence intervals, and n for each model is listed in Table S6.

